A GC log includes details of the entire GC process and the resources it uses.
Analyzing GC log can help troubleshoot long pause problems and optimize overall Java application performance.
- OpenJDK 8 and 11
- Serial GC, Parallel GC, CMS GC, G1 GC, ZGC
The supported features are as follows:
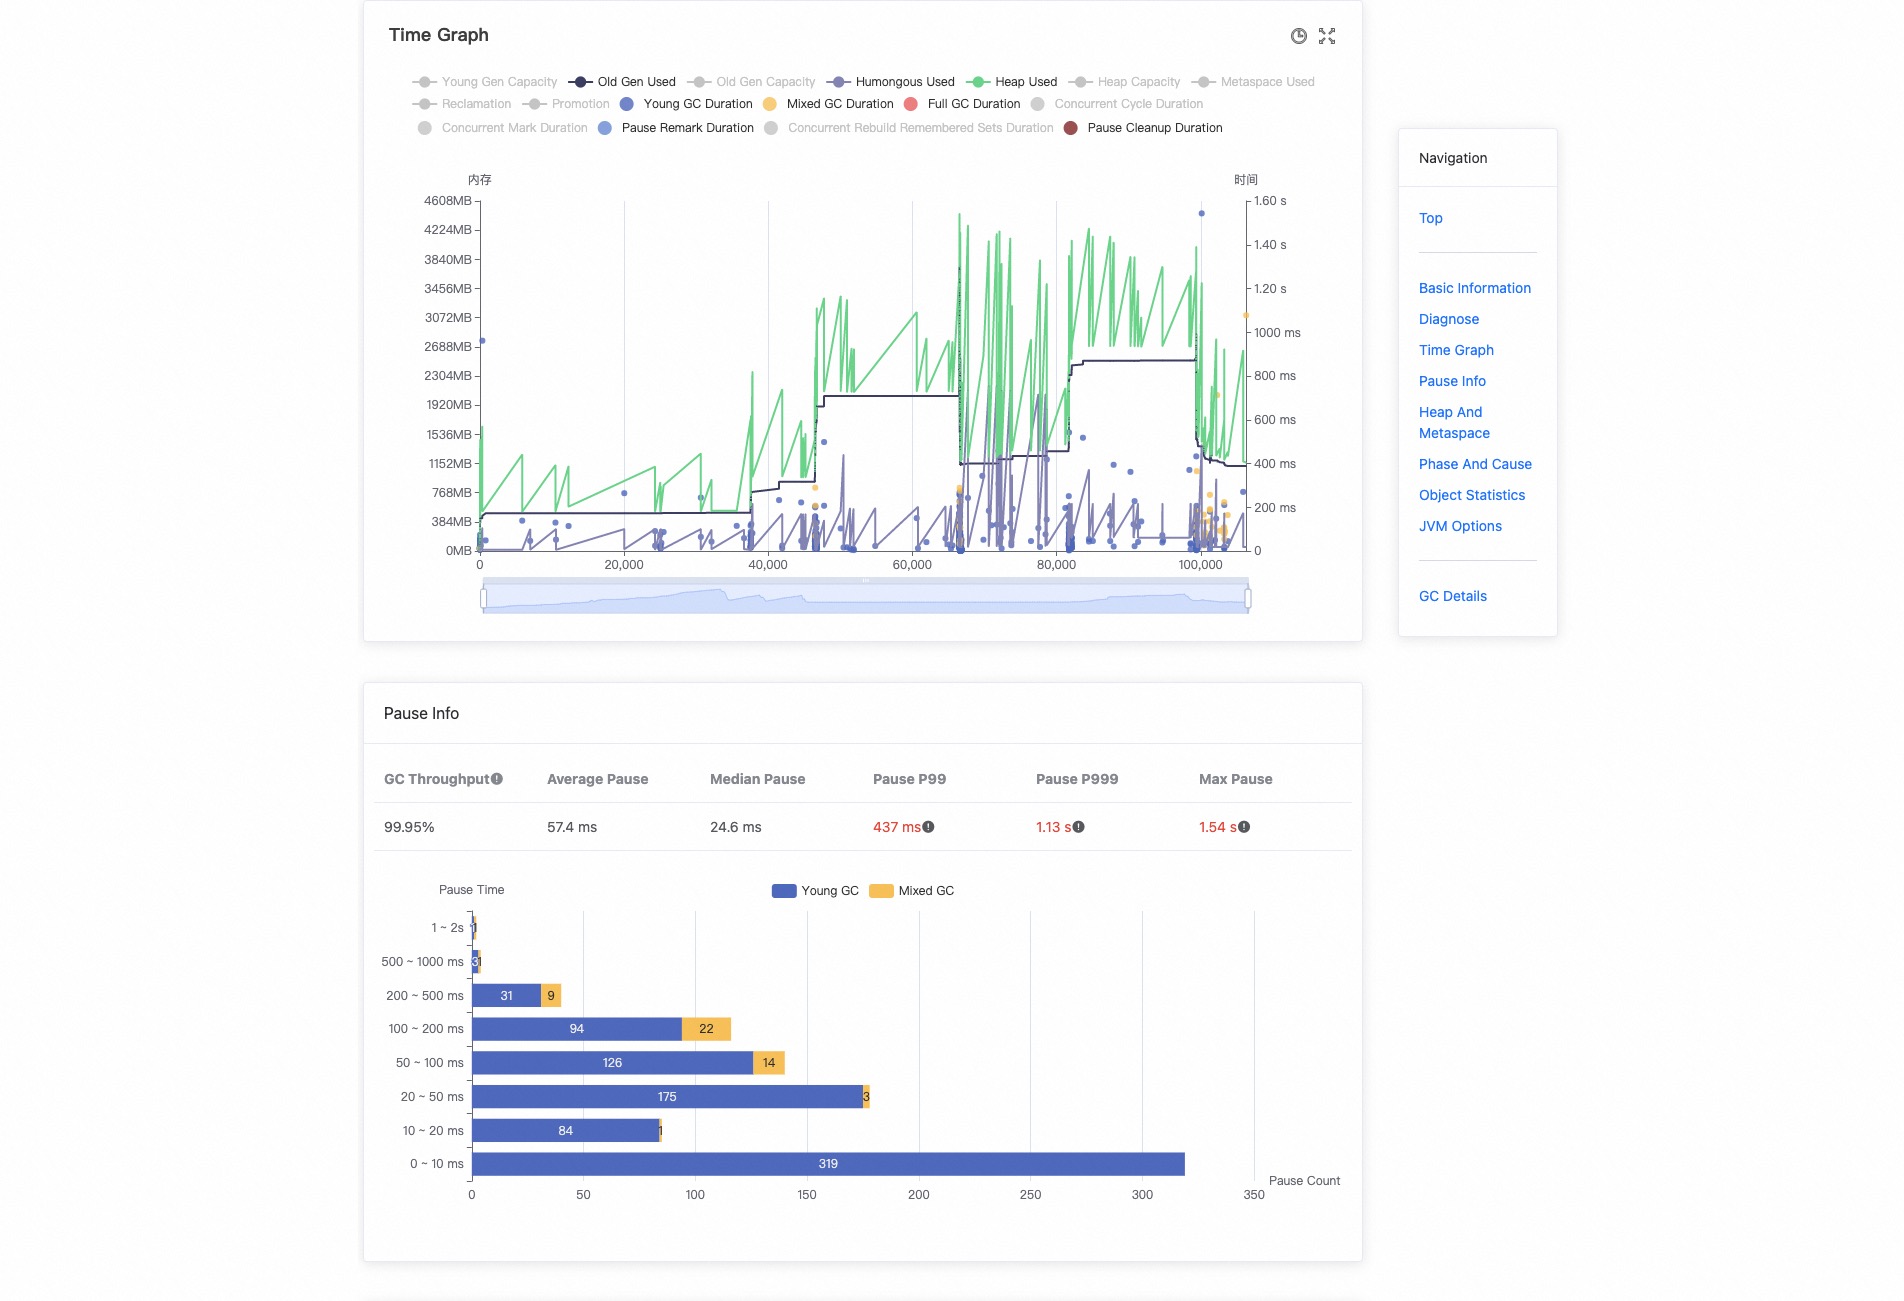
- Overview
- Key Performance Indicators
- Problem suggestion
- GC Cause
- Graphs over time
- GC Details
- Other features
Then main entrance of the feature is in GCLogAnalyzer.parse. There are 3 main steps :
-
GCLogParser will parse the original GC log file into GCEvents, recording direct information from the file. This is done by first recognizing the format and collector of the log, then parse each line using corresponding parsing rules.
-
GCModel.calculateDerivedInfo will calculate more metrics we can get from original info, such as promotion of single event and max pause time of the whole process. All these data are saved in GCModel.
-
Frontend pages displays information through gclog backend apis.