The model was originally implemented in NEST SLI format and the scripts for this version are here (based on code obtained here).
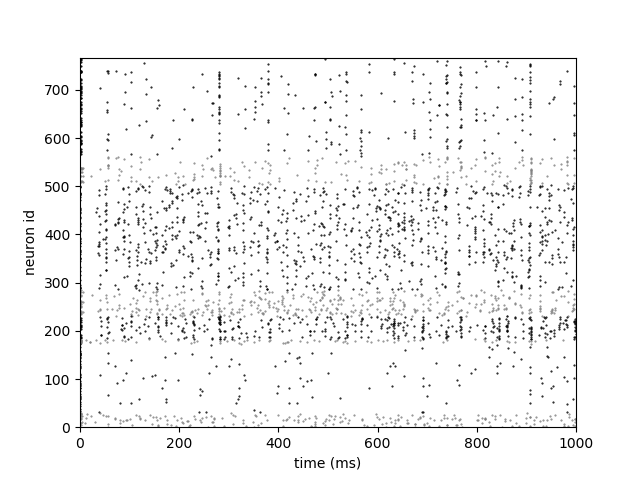
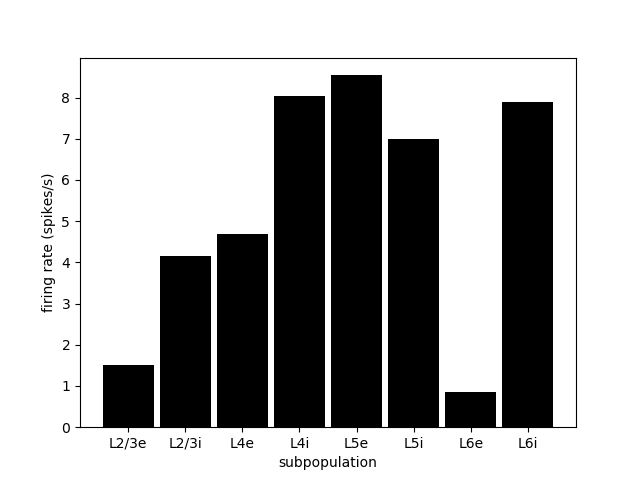
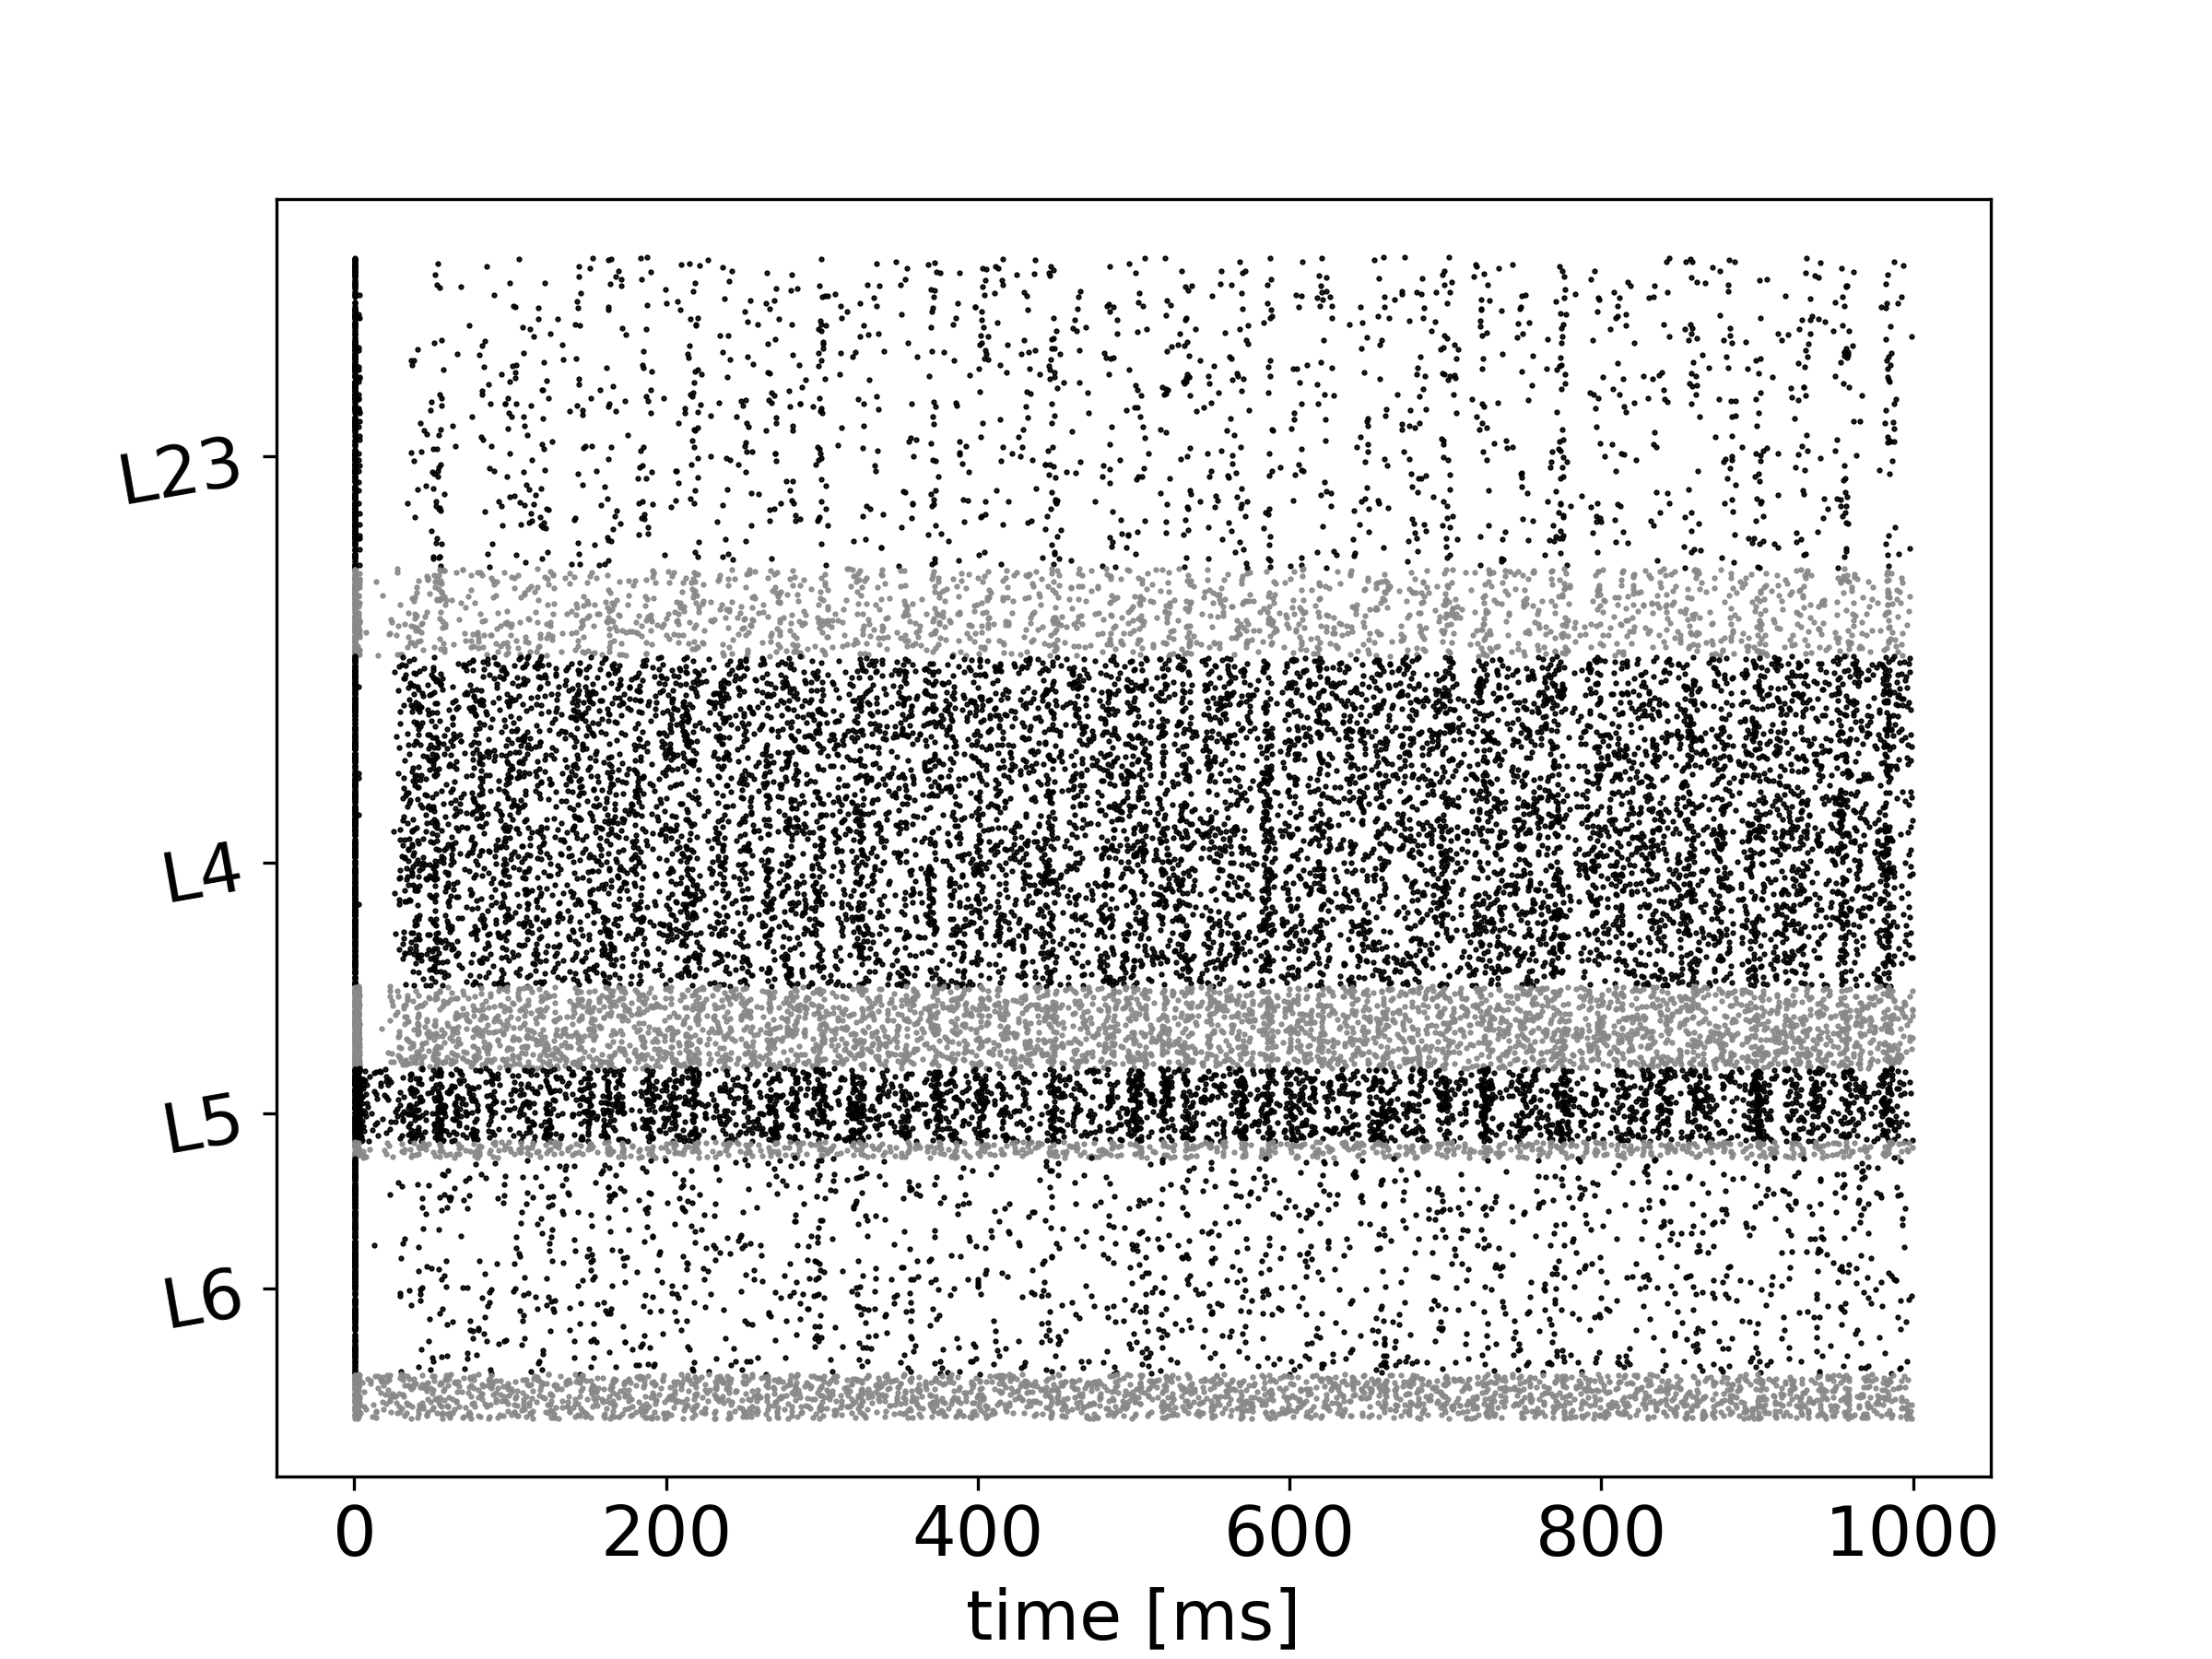
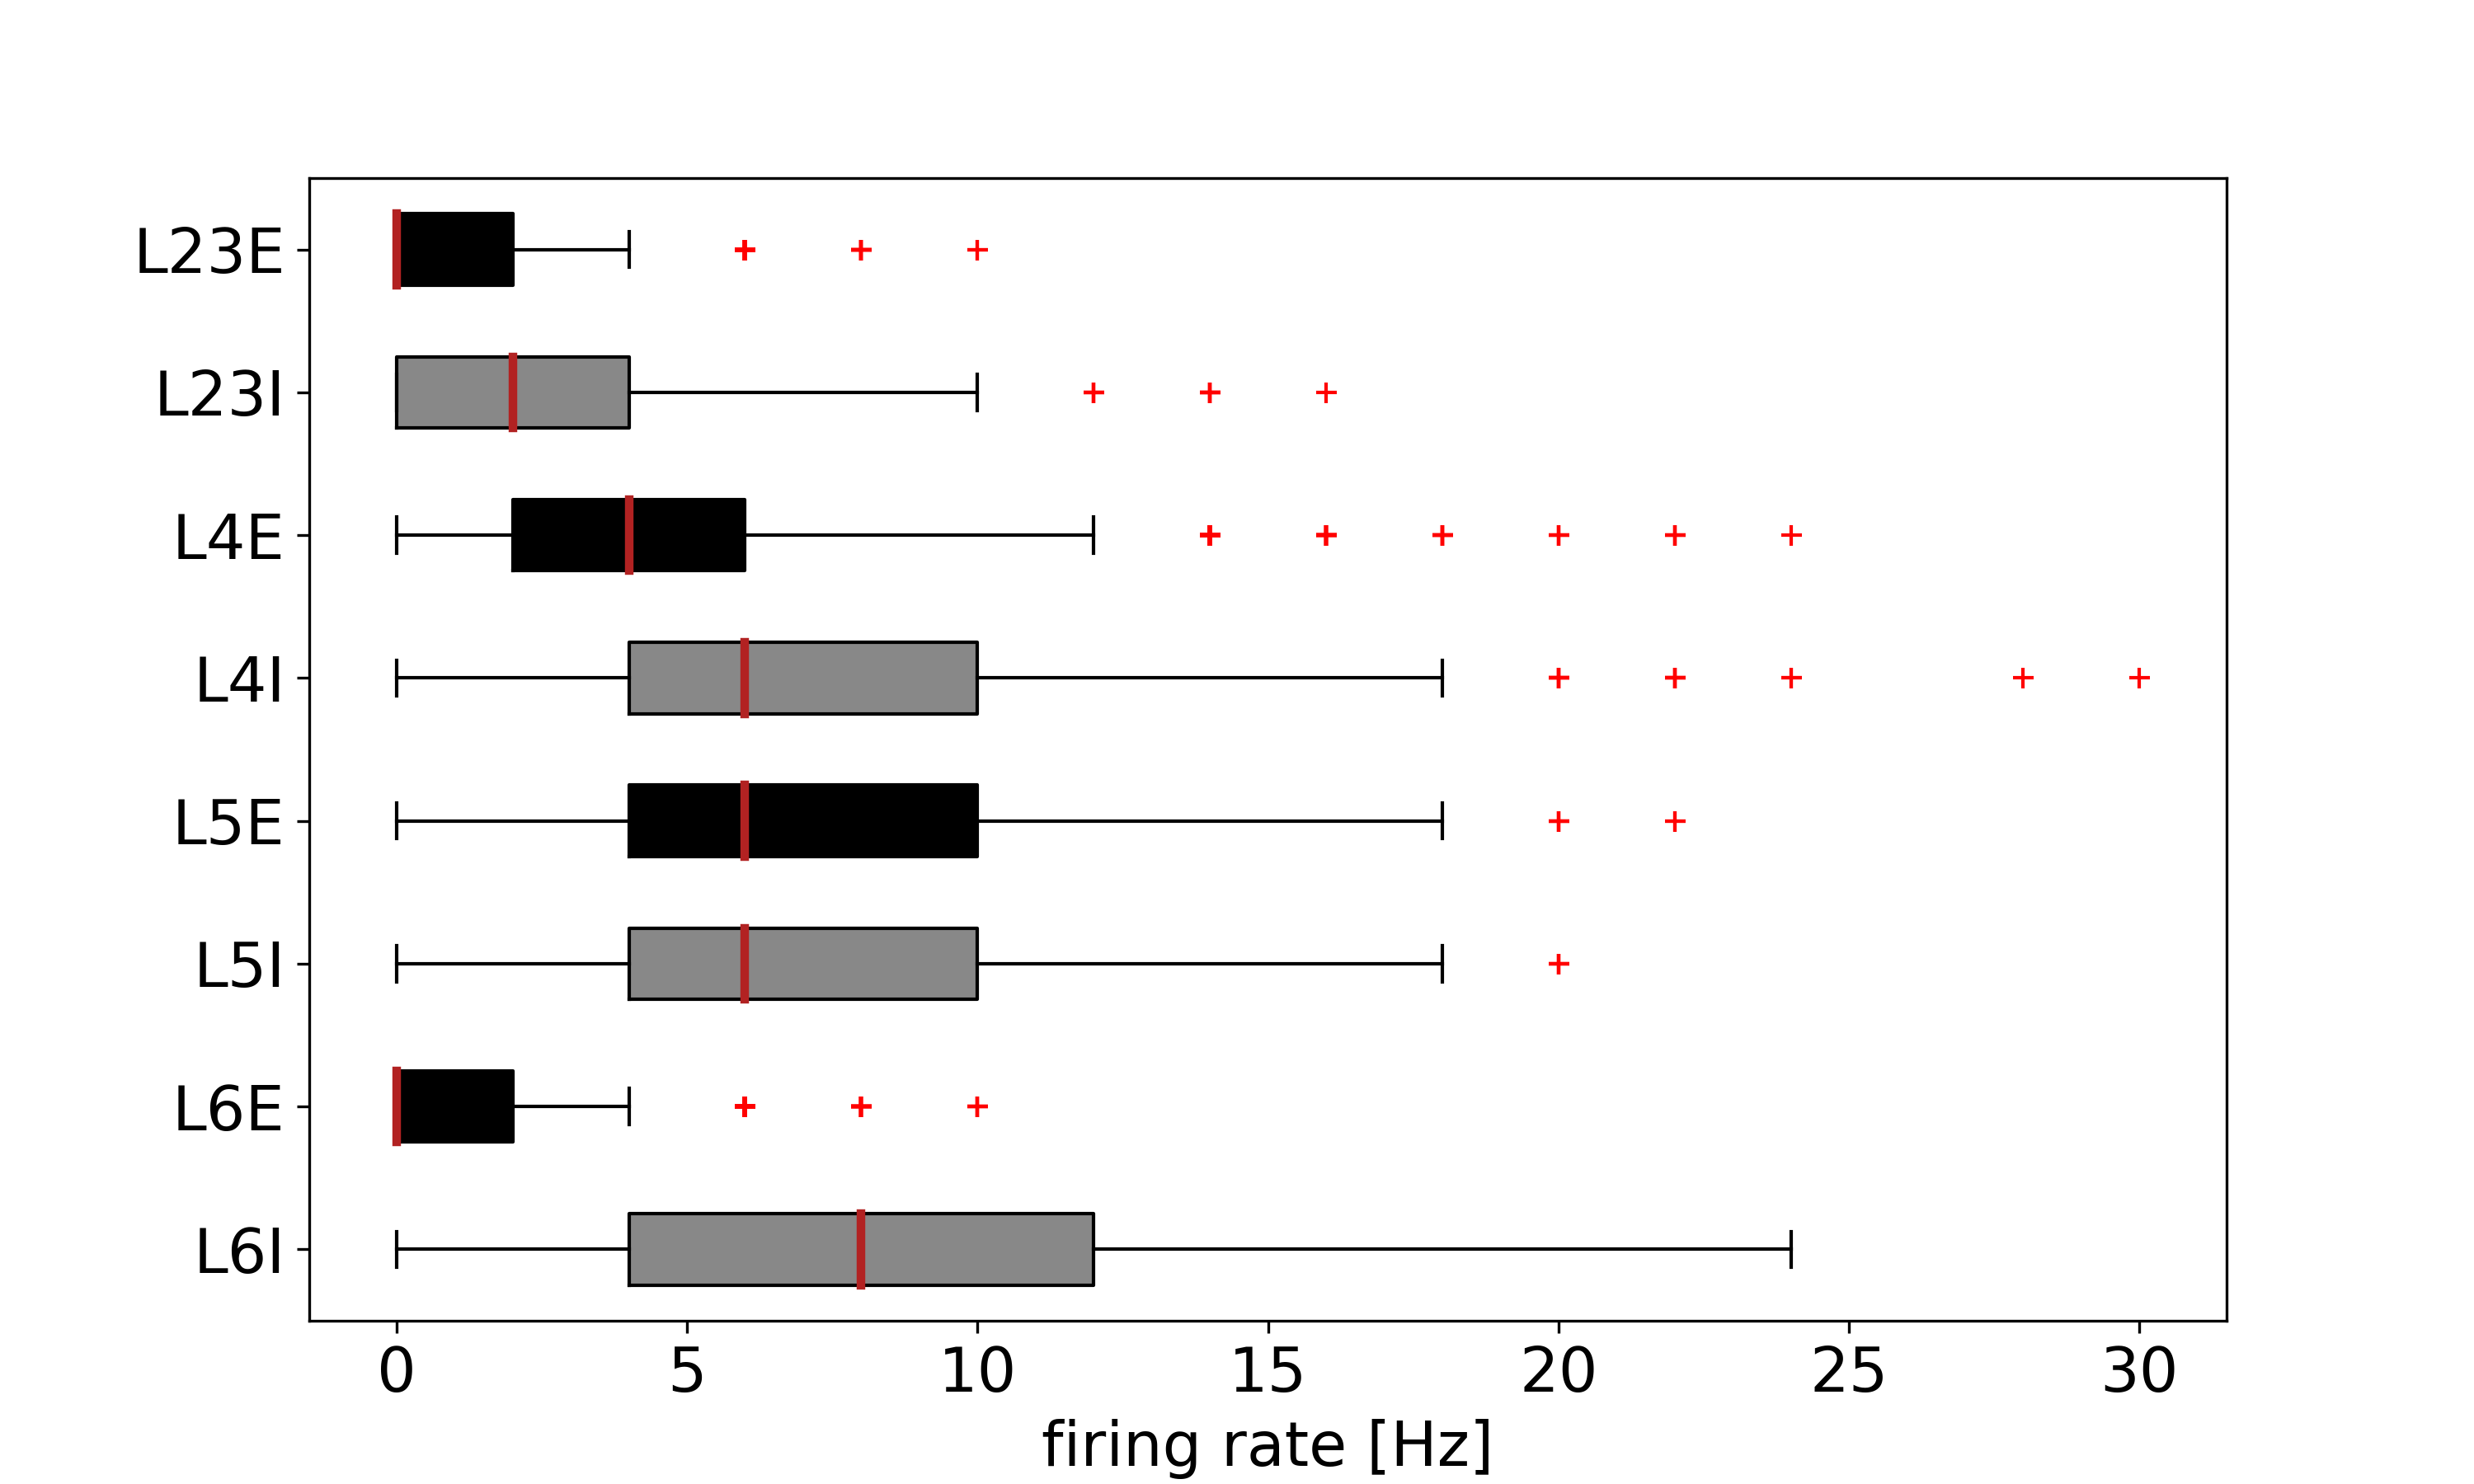
10% scaled down version
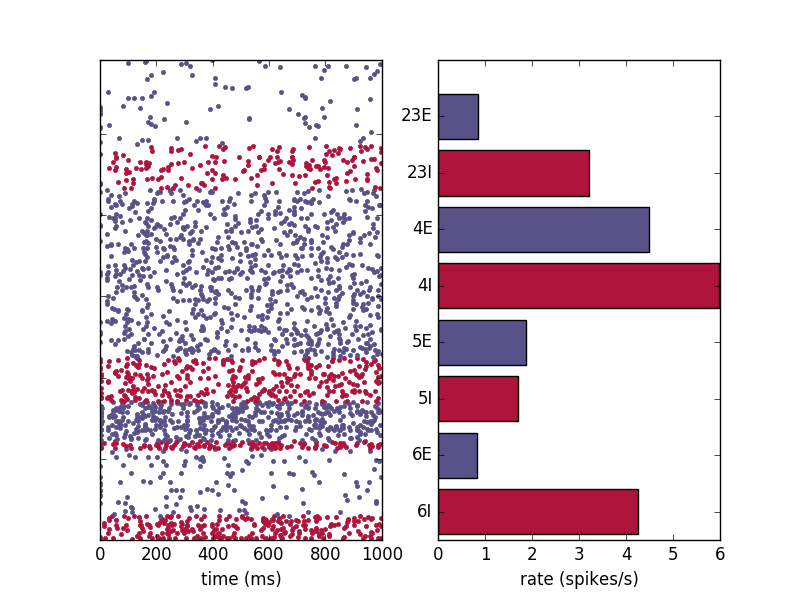
Note 1: 10% of cells in the network are included in rasterplots on the left.
Note 2: rasterplots include first 200ms to enable comparison between implementations at startup, but firing rates on right are calculated on 200-1000ms.
 |
 |
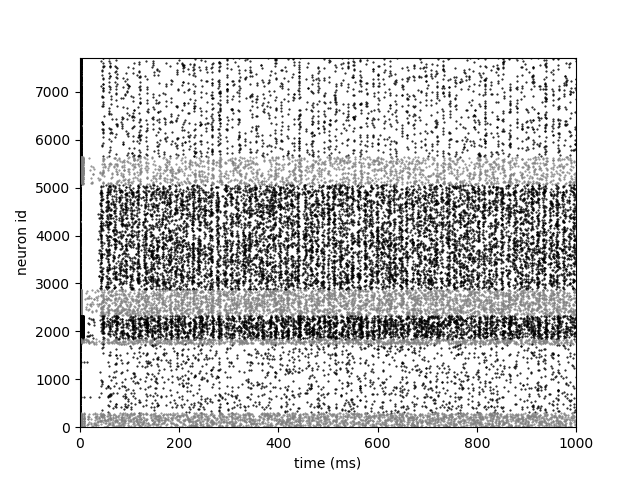
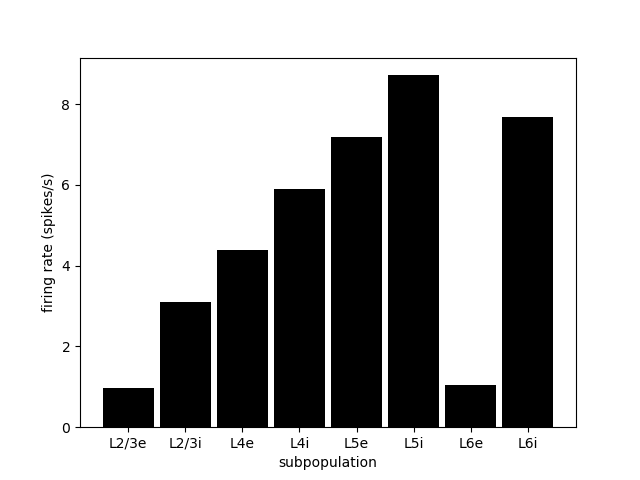
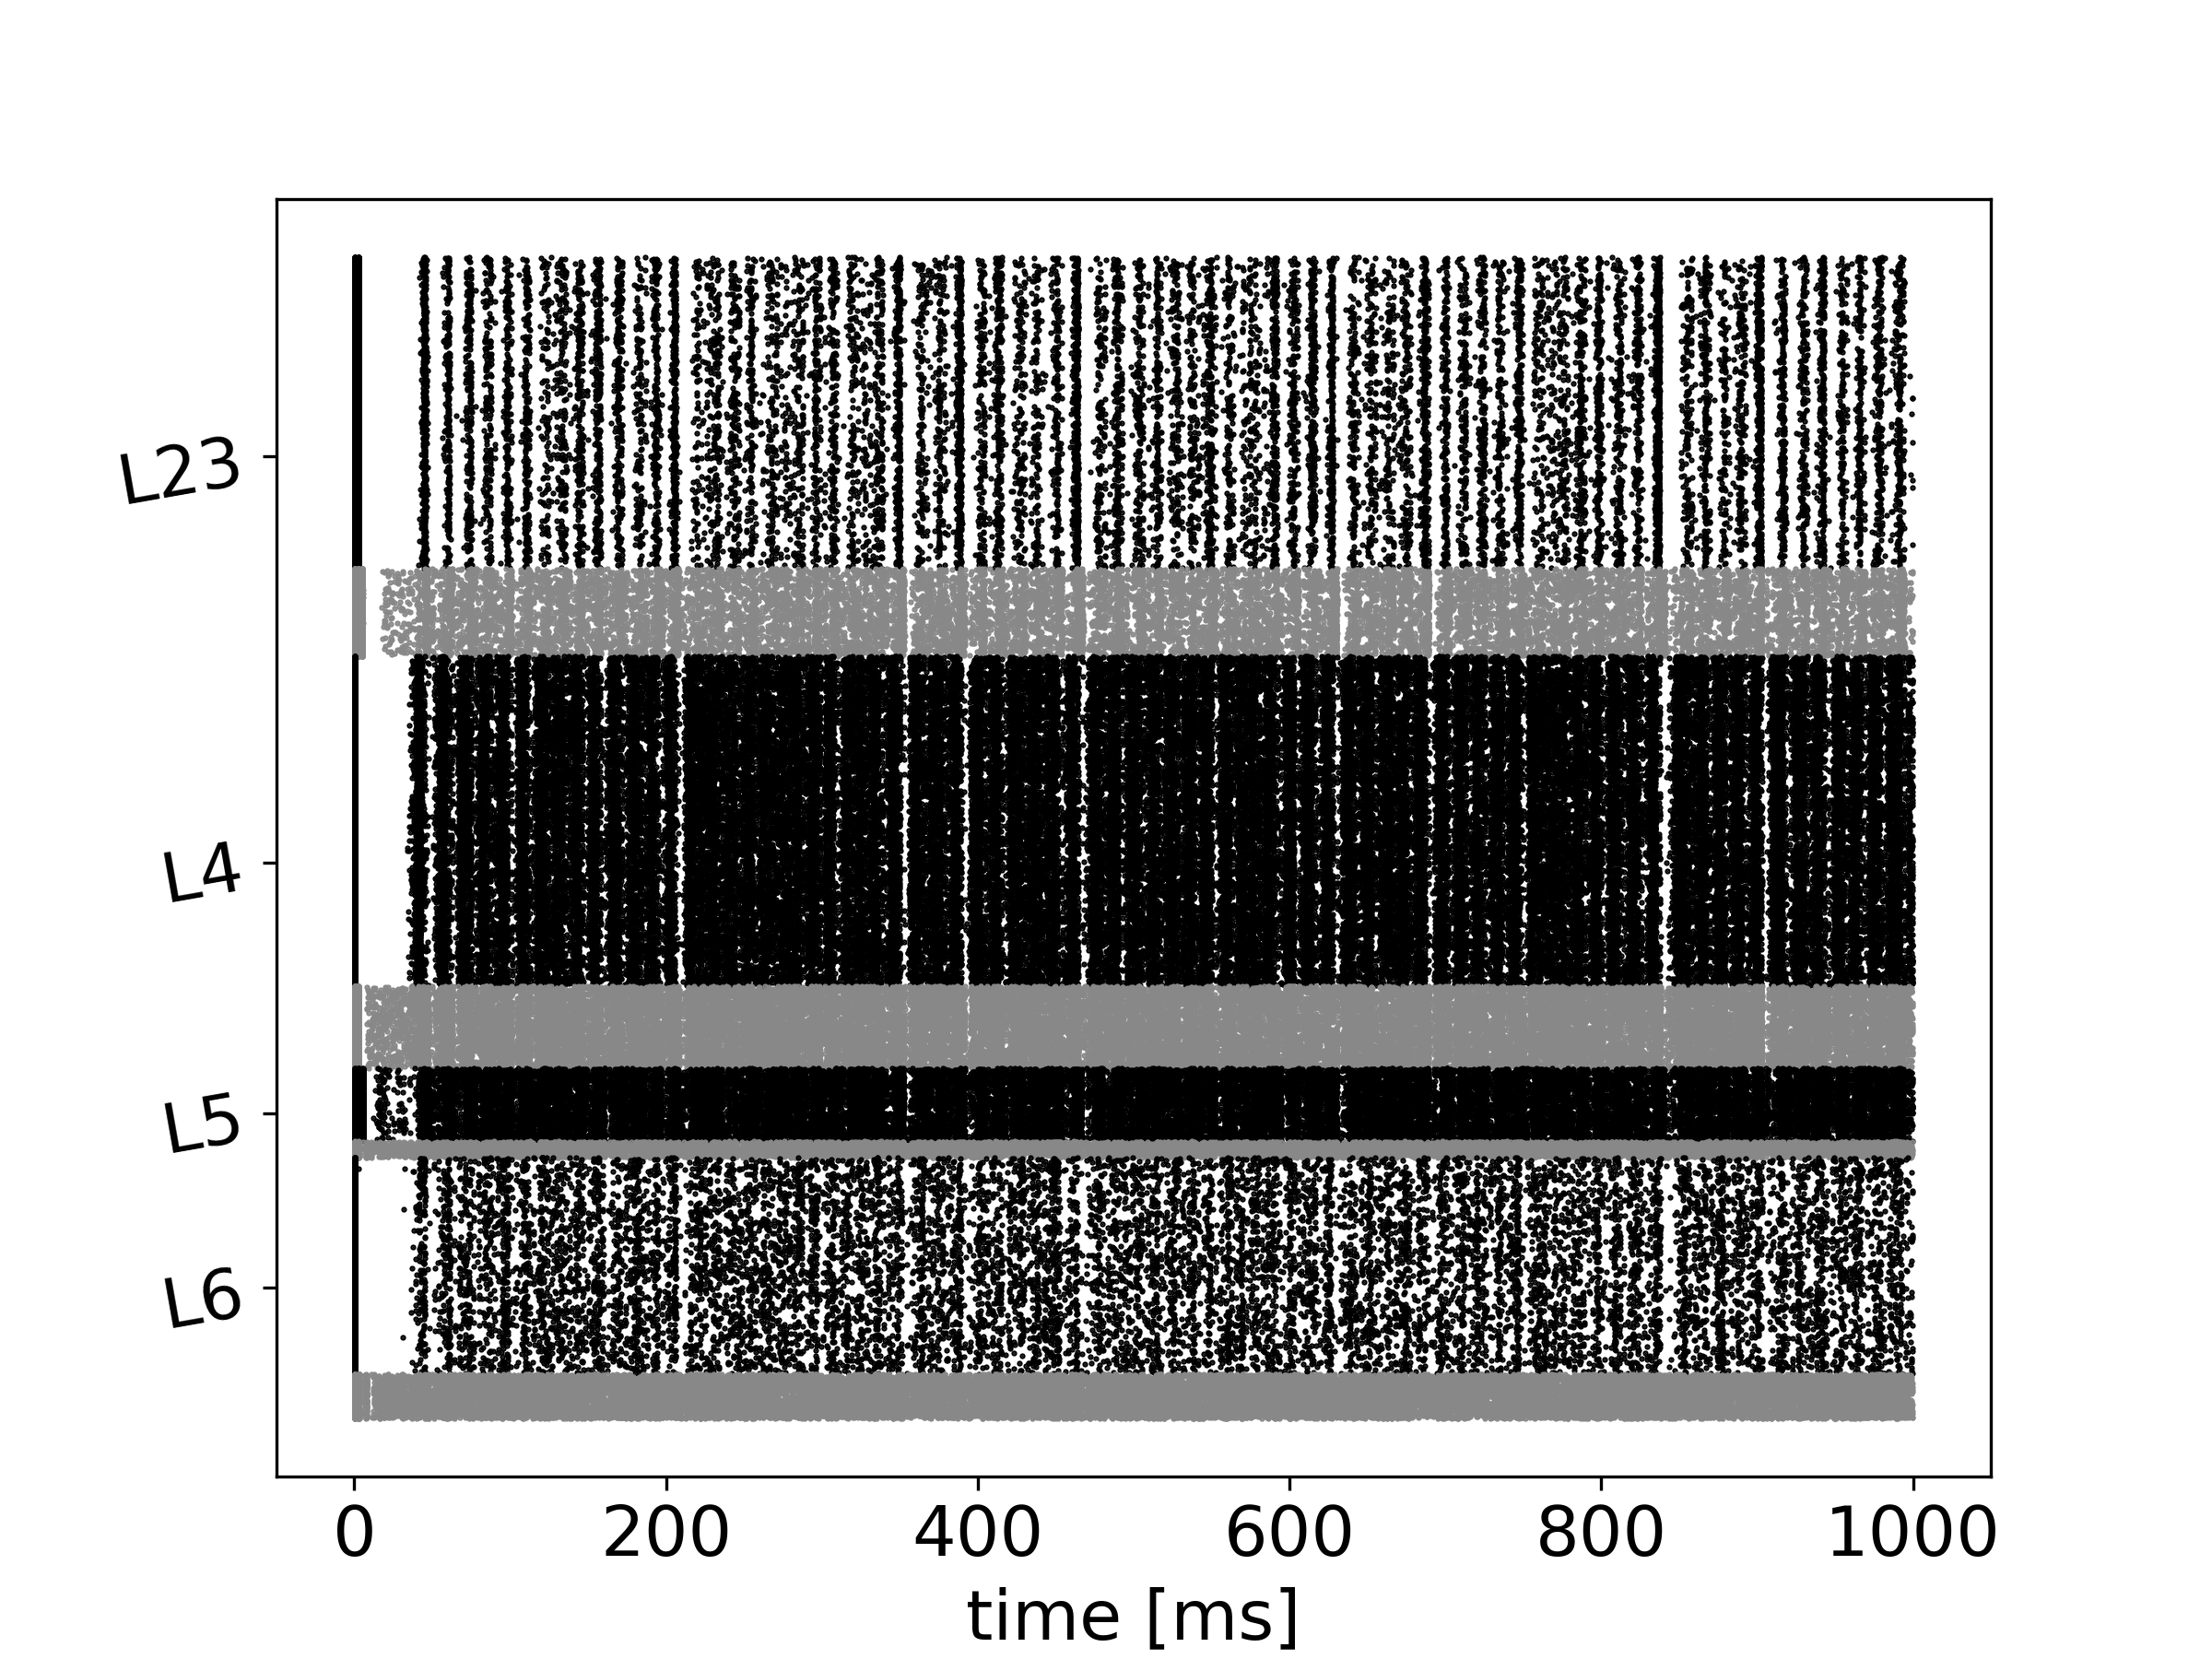
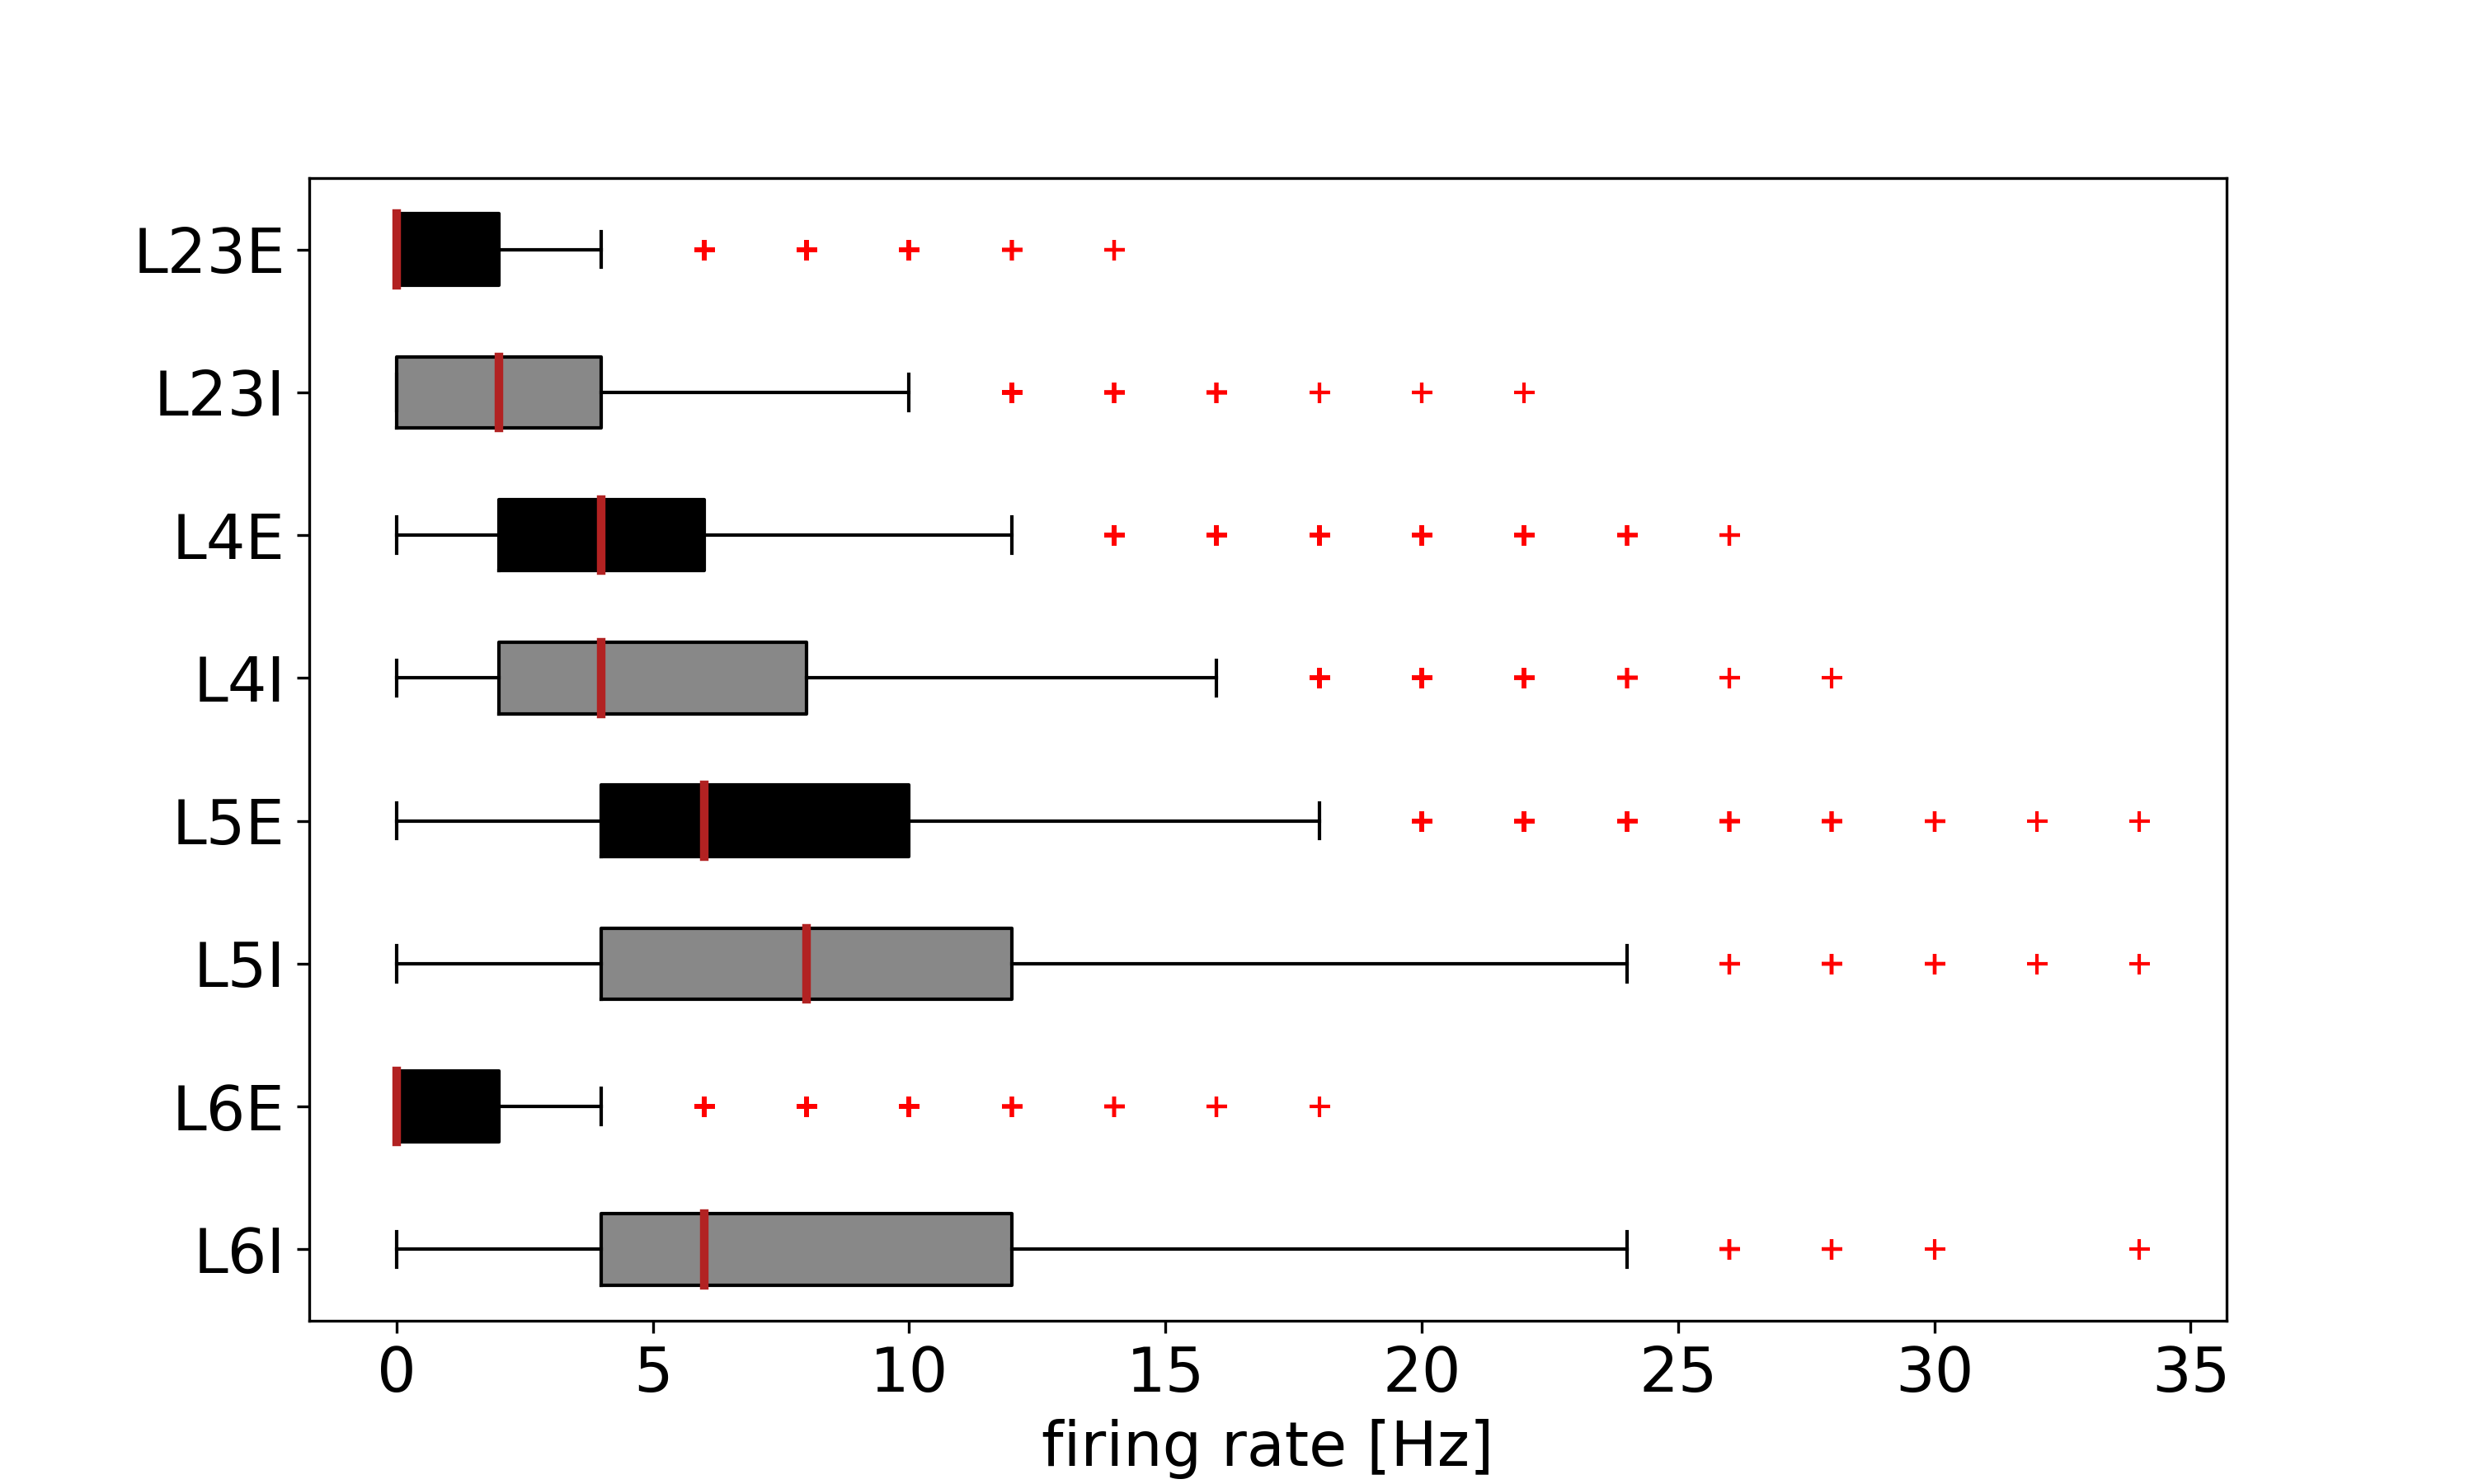
Full scale version
 |
 |
The model was reimplemented by the NEST developers in PyNEST and the scripts for this version are here.
10% scaled down version
 |
 |
Full scale version
 |
 |
10% scaled down version
 |
Full scale version
 |
10% scaled down version
 |
Full scale version
 |