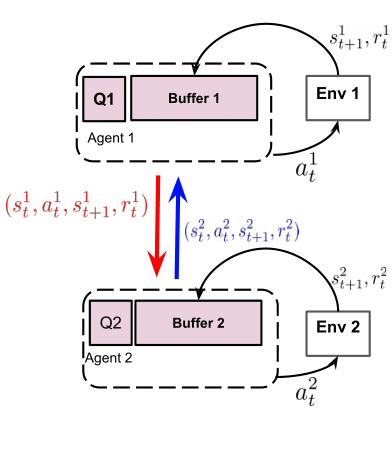
SAPIENS is a reinforcement learning algorithm where multiple off-policy agents solve the same task in parallel and exchange experiences on the go. The group is characterized by its topology, a graph that determines who communicates with whom.
As this visualization shows in our current implementation all agents are DQNs and exchange experiences have the form of transitions from their replay buffers.
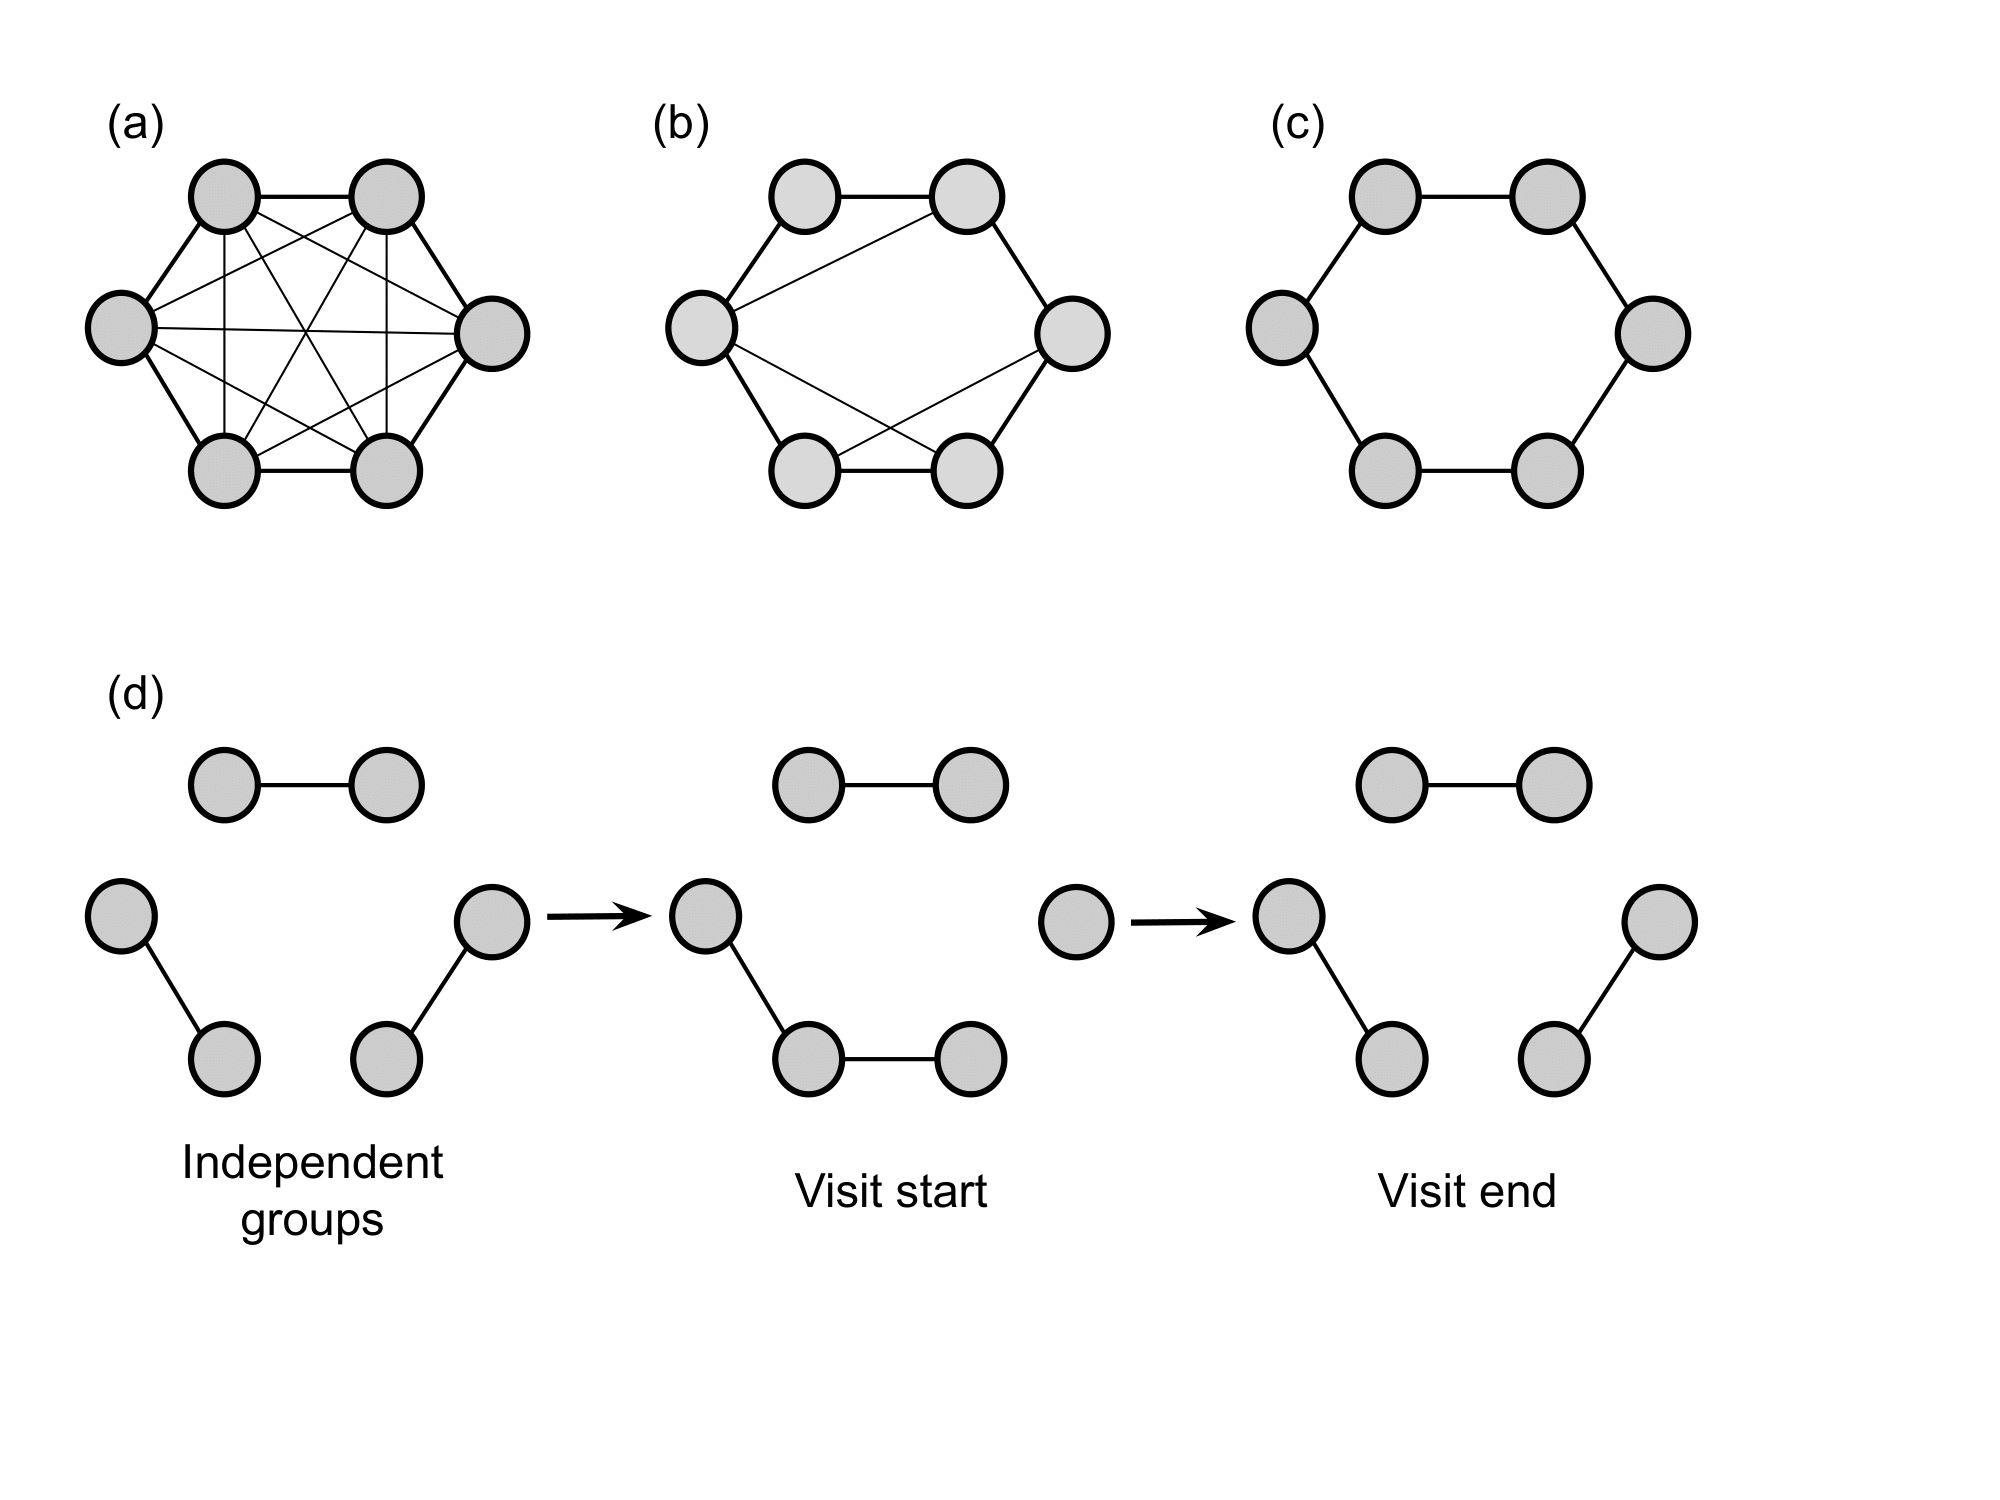
Using SAPIENS we can define groups of agents that are connected with others based on a a) fully-connected topology b) small-world topology c) ring topology or d) dynamic topology
You can install all required python packages by creating a new conda environment containing the packages in environment.yml:
conda env create -f environment.yml
And then activating the environment:
conda activate sapiens
Under notebooks there is a Jupyter notebook that will guide you through setting up simulations with a fully-connected and a dynamic social network structure for solving Wordcraft tasks. It also explains how you can access visualizations of the metrics produced during th$
Scripts under the scripts directory are useful for reproducing results and figures appearing in the paper.
With scripts/reproduce_runs.py you can run all simulations presented in the paper from scratch.
This file is useful for looking at how the experiments were configured but better avoid running it: simulations will run locally and sequentially and will take months to complete.
Instead, you can access the data files output by simulations on this online repo.
Download this zip file and uncompress it under the projects directory. This should create a projects/paper_done sub-directory.
You can now reproduce all visualization presented in the paper. Run:
python scripts/reproduce_visuals.py
This will save some general plots under visuals, while project-specific plots are saved under the corresponding project in projects/paper_done

