This is the base repository for the Camel Spring Boot Tuning Guide blog post.
The goal of this lab is to have an environment ready for load test a simple REST Camel application deployed in two machines. The fist machine app_default is the application installed "as is", without any kind of tuning or fancy configuration. The second one, app_tuned, all the components from the application architecture have been modified to achieve more performatic requests and reliability. The architecture is illustrated below:
+-----------------------+        +---------------------------+      +------------------------------+
|                       |        |                           |      |                              |
|     Apache HTTPD      |        |   Camel Spring Boot App   |      |      Internal Mock Web       |
|     Reverse Proxy     +------->+     (Embedded Tomcat)     +----->+ (Python Simple HTTP Server)  |
|                       |        |                           |      |                              |
+-----------------------+        +---------------------------+      +------------------------------+
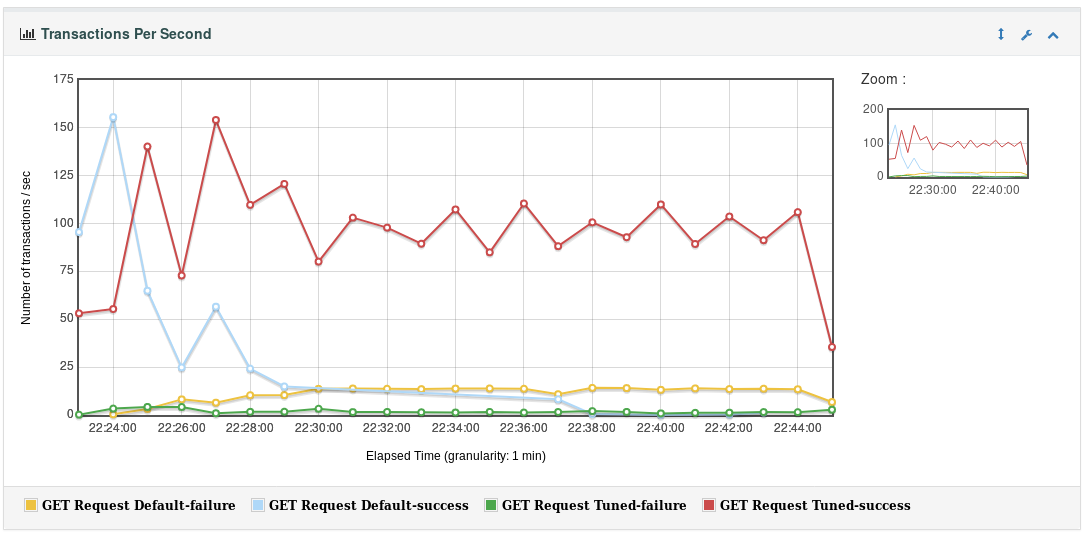
In general, the VM app_tuned performs almost 300% better. See the chart below of one of the load tests run:
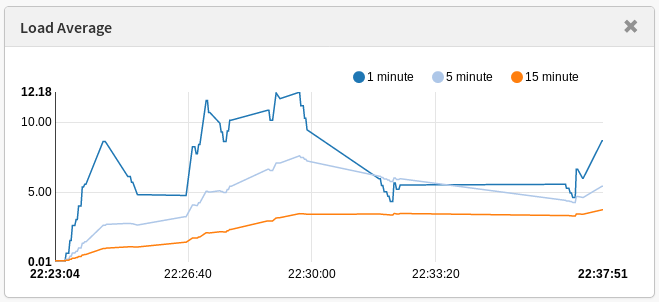
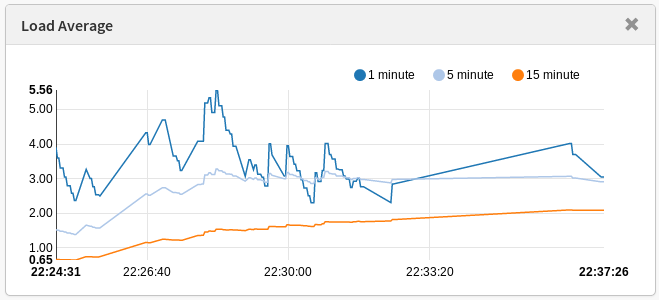
If we check the VM's load average, there's another surprise:
The app_default has the worst performance, while consuming much more resources than the app_tuned.
The VM app_default doesn't handle all the requests (150 simultaneous users) during much time, since in our experiments its JVM always crashes.
Please read the blog post about what has been done in this lab regarding tuning. Note that is not that much, but people tends to neglect the most obvious tuning aspects all the time. I hope this can be helpful somehow. I love to write and hack configurations, if you'd like to talk about it, reach me out.
To run this lab, you're going to need:
- Vagrant
- VirtualBox for Vagrant provider
- Vagrant Plugin Hostmanager
:
vagrant plugin install vagrant-hostmanager
- VirtualBox
- Ansible
- JMeter for load tests
- PCP Vector to collect the VM metrics (optional)
- JVisualVM to collect JVM metrics like GC behavior (optional)
- Maven to build and deploy the application
Having the requirements installed, run the script start.sh that will build the application and provision the machines used in this lab. The Ansible playbooks are going to install all software needed to have this lab set.
Then you can run the JMeter Load Test to see the results in place. You can ssh in the machines (vagrant ssh app_tuned) and play with the configurations to see if the application performs even better. If you do, please share your results.
After runing your tests, you can destroy your VMs by runing ./destroy.sh in the project home.
- Configure the
user.propertieson JMeter home according to the dashboard documentation - Save the CSV result file on the
Aggregate Reporttab ($PROJECT_HOME/jmeter/results.csv) - Generate the report after performing the load test by running
jmeter -g jmeter/results.csv -o jmeter/results-output.
Both machines are provisioned with pcp installed and enabled. To view your metris during your load test, install Vector on your host and open two tabs, pointing each one to app.local and app2.local:
- http://localhost:44323/vector/index.html#/?host=localhost:44323&hostspec=app.local
- http://localhost:44323/vector/index.html#/?host=localhost:44323&hostspec=app2.local
The JMX management is available at te port 12349. Just add this port to your favorite JMX management tool and start extracting JVM metrics during your load tests.
Enjoy!


