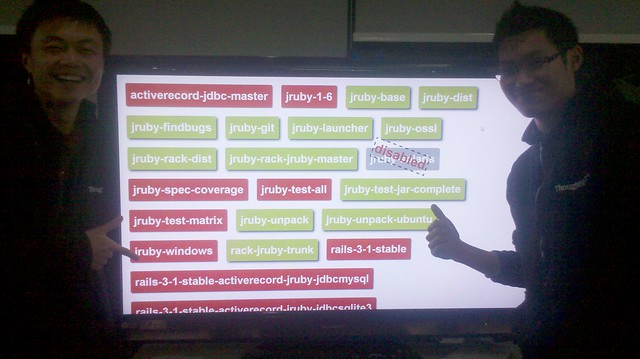
A project aims at helping you show status of build in blue(building), red(failure), green(success) box on jenkins. By using jquery jsonp support and jenkins built-in jsonp reponse support, implementing this is just a piece of cake.
It's very important to radiate build status on jenkins(passively). So that everybody in the team can just raise your head a little bit and take a look at the builds on screen(it could be in big TV),whether it is red/blue/green. Also it borrows very similar metaphor from Test Driven Development rhythm. Red color box means that build is failed, someonebody in the team may need to take a look at it;Green means "yep, success";Blue means that build currently is building; Grey means that build is aborted or disabled.
git clone git://github.com/tuo/jenkins-monitor.git
Then copy or rename conf/config.js.sample to conf/config.js:
copy conf/config.js.sample conf/config.js
or
mv conf/config.js.sample conf/config.js

And open conf/config.js to change your jenkins ci address and jobs name you want to show on dashboard like following:

	var ci_url = "http://ci.jruby.org/view/Ruboto";
	var jobs_to_be_filtered = ["apitest", "ergonomics"];
Then run from command line:
open dashboard.html -a safari
This project is still working in progress. Suggestions? Email to: [email protected]
