| layout | title |
|---|---|
page |
About Vistat |
{% include JB/setup %}
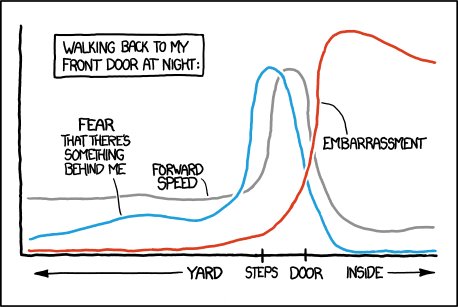
Statistical graphics are powerful in terms of conveying information. When we see a good graph, we often wonder how it was made (e.g. the one below via xkcd).
Vistat aims to be a journal-like website, publishing code to reproduce useful or interesting graphs. It is based on Github/Jekyll, and graphs are generated dynamically through the R package knitr, hence reproducibility is guaranteed.
-
{% for post in site.posts limit:5 %}
- {{ post.date | date_to_string }} » {{ post.title }} {% endfor %}
You can fork the repository on Github, add your article to the _source directory and submit a pull request to us. We will run your code and upload images. For more details, see about.
All the content in this website is licensed under CC BY-NC-SA 3.0. This site is hosted on GitHub Pages using the Dinky theme for Jekyll Bootstrap.