A simple tool to find and visualize the resulting unique sums you get when you sum compositions of a set of numbers.
Compositions - Combinations with replacement
Number Set - {0, 1, 2, 3, 4, 5, 6, 7, 8, 9, 10}
The number of ways you can arrange compositions of this set when you pick 5 (with replacement) is 3003 and those compositions have 51 unique summations.
0: 1
1: 1
2: 2
3: 3
4: 5
5: 7
6: 10
7: 13
8: 18
9: 23
10: 30
11: 36
12: 45
13: 53
14: 63
15: 72
16: 83
17: 92
18: 103
19: 111
20: 121
21: 127
22: 134
23: 137
24: 141
25: 141
26: 141
27: 137
28: 134
29: 127
30: 121
31: 111
32: 103
33: 92
34: 83
35: 72
36: 63
37: 53
38: 45
39: 36
40: 30
41: 23
42: 18
43: 13
44: 10
45: 7
46: 5
47: 3
48: 2
49: 1
50: 1
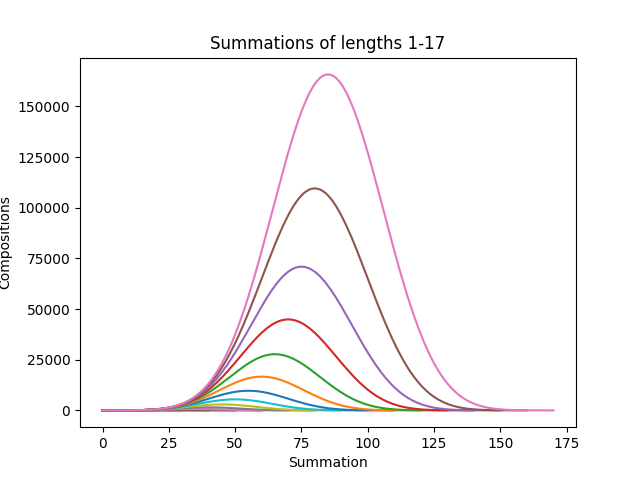
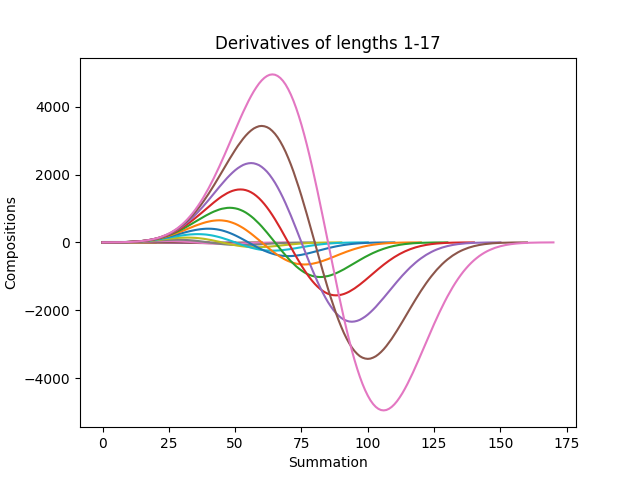
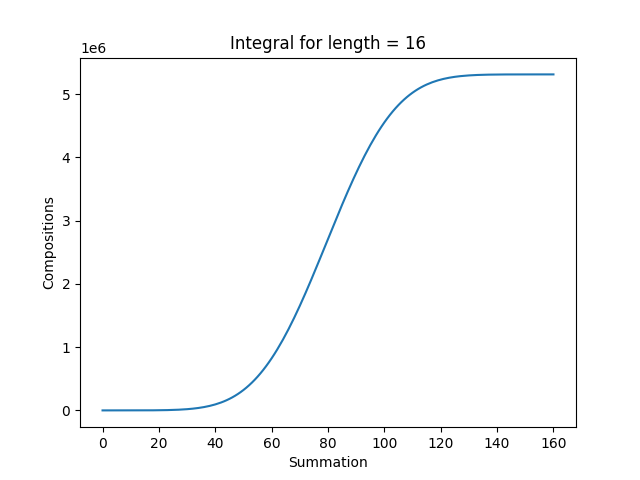
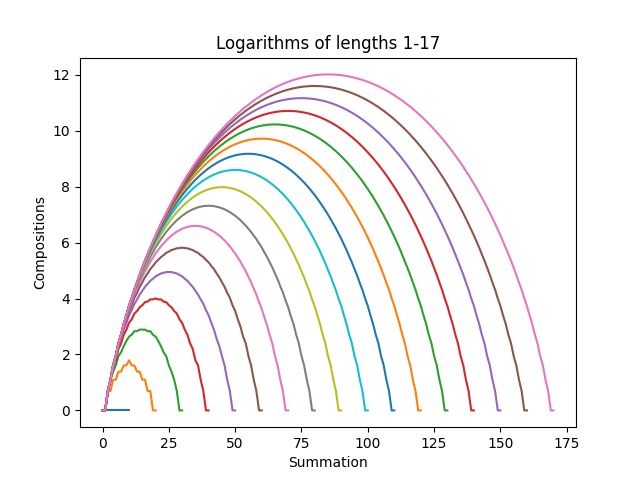
There exists a visualization script graphs.py to create graphs from this generated data. The script has commented examples and the data folder has pre calculated sum data.
All examples use the number set {0, 1, 2, 3, 4, 5, 6, 7, 8, 9, 10}


