Having followed the cryptocurrency market for a while now, I decided to do some exploring in the data available from coinmarketcap. Especially in light of the increasing number of successful coins and decreasing Bitcoin dominance in terms of market capitalisation, I assume many investors are eager to understand the dynamics in this market.
Data updated 28/06/2017; Improved market return calculation; Restricted some visualizations to data from 2017
This is a work in progress. Steps taken so far:
-
Obtain and clean data from coinmarketcap using coinmarketcap-scraper. This gives us daily closing prices for each coin.
-
Calculate Overall market capitalisation and Herfindahl index to illustrate the change in market capitalisation and competition between coins.
The Herfindahl index measures competition in a market by summing the squares of all competitor market shares. It ranges from 1/N (highly competitive) to 1 (high concentration), where N is the number of competitors. More information.
- Here, we see that both market capitalisation and competition are increasing over time.

-
Calculate the daily return for each coin.
The rate of return is the income from an investment expressed as a proportion of the original investment. Hence, here it is
(price(t) - price(t-1)) / price(t-1). More information.- Using this data, we can plot the daily returns for arbitrary coins on a time axis. Example: Comparing returns for bitcoin, ethereum and ripple

-
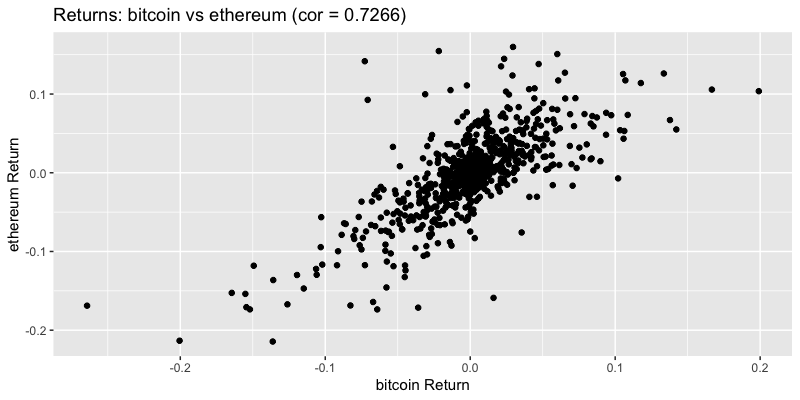
This also allows us to investigate the correlations between the daily returns of arbitrary coins. Example: Plotting bitcoin vs ethereum returns. Here, every point represents one day. Note that this plot is based on data from 2017 only.
Correlation measures the linear relationship between two sets of data. A high value when comparing the daily returns of two coins indicates a positive linear relationship of the returns in the past.
-
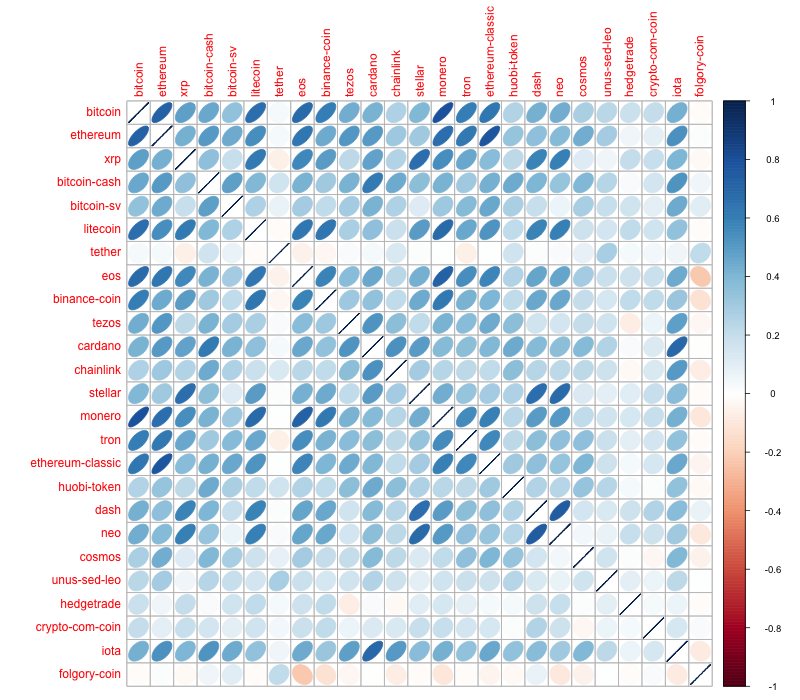
Finally, we can look at pairwise correlations between all coins: Visualisation of the correlation matrix for top 25 cryptocurrencies. Note that this plot is based on data from 2017 only.
The (symmetric) correlation matrix visualises the correlation for each pair of variables - from perfect positive linear relationship (blue) to perfect negative linear relationship (red).
-
Calculate overall market returns using daily values for overall market capitalisation. This series is initially dominated by bitcoin, with more altcoin influence as their market capitalisations increase.
- Corresponding to the first plot, we can now give a plot of the overall Market return across time:

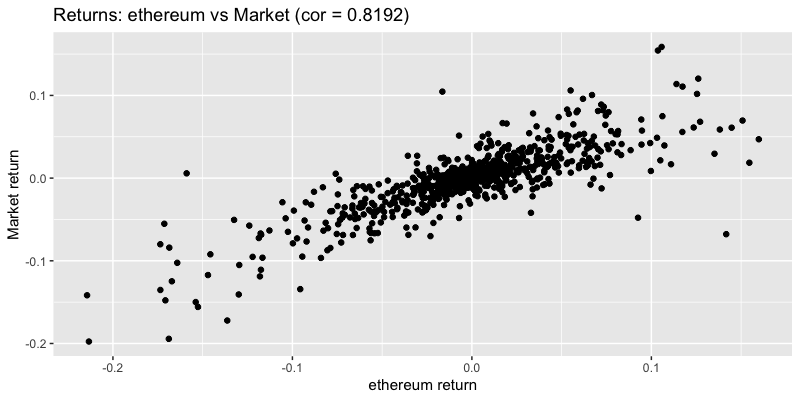
- Similarly, we can investigate the correlation of arbitrary coins with the market return. Example: Plotting ethereum vs market return. Note that this plot is based on data from 2017 only.
-
Calculate coin
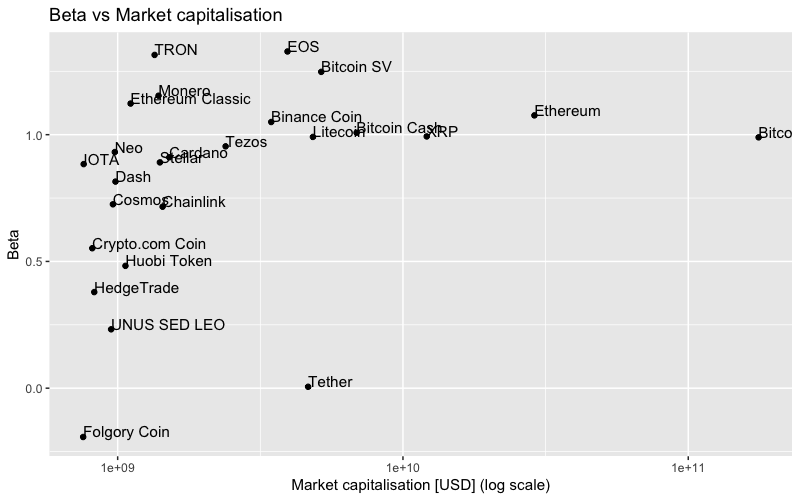
betato characterise the behaviour of each coin return with respect to the market return.-
Beta represents the covariance of coin returns and market returns, scaled by the variance of the market returns. See Wikipedia for more information.
Investors use the information encoded in the beta coefficient to characterise an asset's volatility and tendency to move in accordance with the market index.
beta = 1indicates that the asset moves exactly like the market index. More information. Here, the market is dominated by bitcoin, hence bitcoin's beta is very close to 1 and a coin's beta can also be interpreted as a comparison to bitcoin's movement. -
Here, we plot coin betas against market capitalisations for the top 20 coins in terms of market capitalisation. Note that this plot is based on data from 2017 only.
-