SLogVIZ is an Simple Log file Visualizer written in Python. It visualizes log files and correlations found among log file entries using matplotlib.
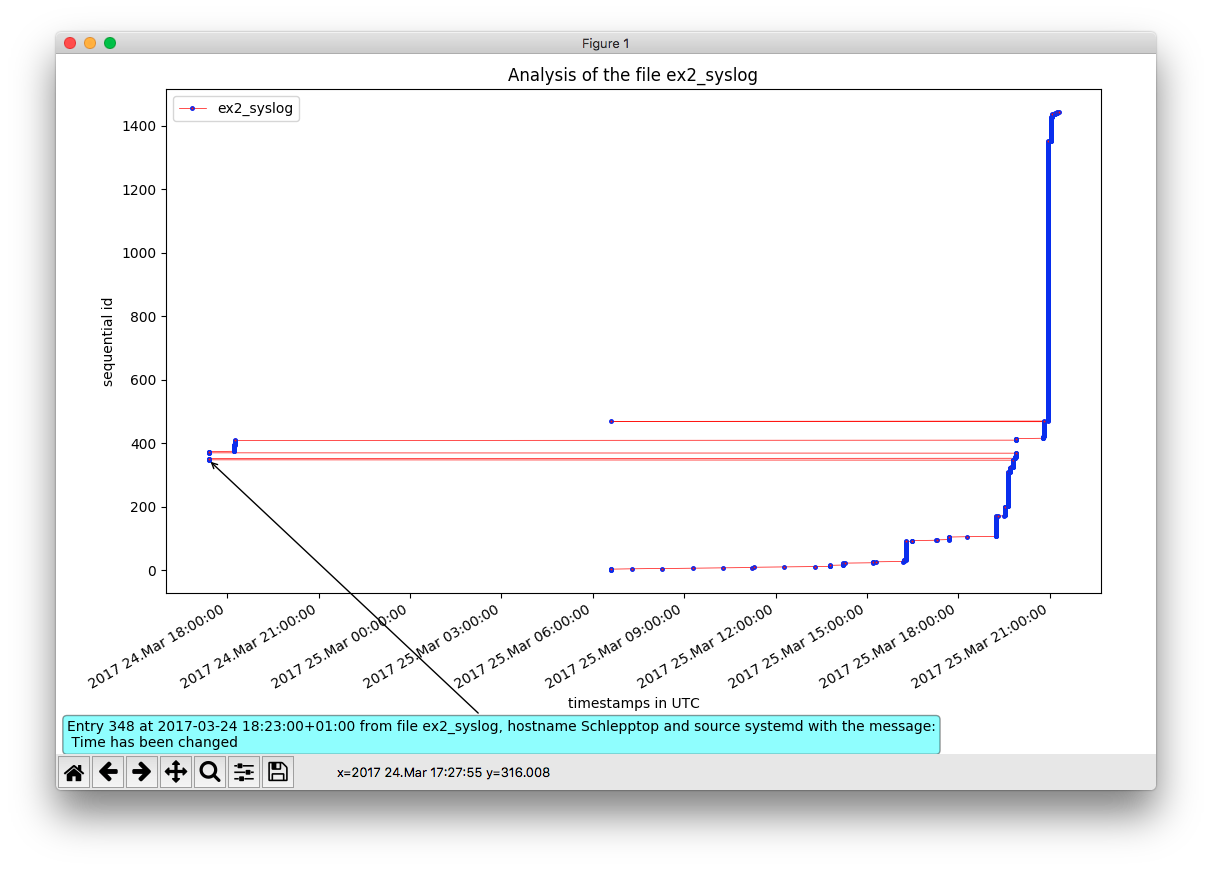
A picture is worth a thousand words:
SLogVIZ is designed to be a helpful tool for forensic investigations by producing visualizations of log files.
At the current state, SLogVIZ is able to parse syslog files , Windows Event Log (evtx) files and SQLite files created by Firefox and Chrome (browsing histories). Due to different timestamps definitions, SLogVIZ may not be able to read all entries of evtx files, when using Windows. In this case a warning is sent to the user.
Additionally, since the parsing of evtx and SQLite file may take up to minutes, SLogVIZ can export log files in a certain JSON format and these JSON files can be parsed faster in the future (see export to JSON).
In order to parse a certain file, the following filenames/extension are required:
| File Formats | File Names/Extensions | Examples |
|---|---|---|
| syslog | *log | syslog, auth.log, system.log |
| evtx | *.evtx | System.evtx |
| SQLite - Firefox | *places.sqlite | places.sqlite, case42_places.sqlite |
| SQLite - Chrome | *History | History, case42_History |
| slogviz-created JSON | *.slogviz.json | syslog.slogviz.json |
SLogVIZ is intended to be executed as a Python module with the Python3 interpreter. Therefore, users have the choice to either install SLogVIZ or just install all dependencies and use SLogVIZ without installing it.
Here is a simple guide on how to get SLogVIZ working:
- install Python 3.5 or higher (pip shall be installed and the PATH needs to include the Python Interpreter, these things should be handled by the default installation process)
- download the latest version of SLogVIZ here and extract the .zip file
- decide whether to install the program or to NOT install it
If you have multiple versions of Python installed, be sure to use the correct Python command for the following steps, as SLogVIZ needs Python 3.5 or higher! In such cases python3 on UNIX or py -3 on Windows is most probably the correct command. In the case that only Python 3.5 or higher is installed, the correct command is most probably python.
To check if a command is correct, simply type <command> --version.
Of course, SLogVIZ can be used in a virtual environment and we strongly recommend the usage of virtualenv.
install:
- navigate to the root directory of the project and enter
<your-python3-command> -m pip install -e .in a terminal, the cmd.exe or Windows-Powershell - now the program can be executed by entering
<your-python3-command> -m slogvizin any working directory
local usage:
- open a console and navigate to the slogviz root directory and enter
<your-python3-command> -m pip install -r requirements.txt - now the program can be executed by entering
<your-python3-command> -m slogviz, but only in the project root directory
When Step 4. does not succeed, please make sure that you have the latest version of pip (upgrading pip) and that you chose the correct Python command.
When executing the module with one or more log files passed via the -f argument, the main loop will be displayed:
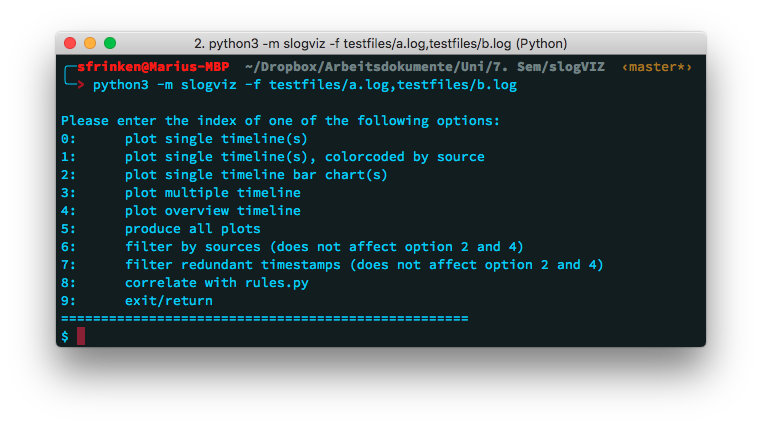
When selecting a plot, a new Window will be opened with the chosen visualization. After closing this window, the main loop is presented again.
Inside the testfiles directory are some sample log files, which might help to understand the usage of SLogVIZ.
All plots produced by SLogVIZ are generated with the matplotlib module, thus the plot window offers various options to interact with it. Additionally, SLogVIZ has a neat feature, that in most plots one can hover with the mouse over a data point and get information about the related log file entry in a text box.
For a detailed description of the different plots offered by SLogVIZ, please see the wiki.
For filtering log files before visualizing, use the command line options or their interactive counterparts, option 6 & 7 in the main loop.
Generally a look at the output of python3 -m slogviz -h / python -m slogviz -h maybe helpful in order to see what command line arguments are available.
SLogVIZ is also able to evaluate log file entries against correlation rules written in Python.
For this purpose, a correlation rule needs to be defined as a function in a file named rules.py inside the current working directory. SLogVIZ comes with a sample file of this type in the testfiles directory, please refer to the documentation of this file for further instructions on how to write correlation rules.
Once such a file is present, simply execute SLogVIZ with the files you want to correlate and choose option 8 in the main loop.
This tool is published under the MIT License, see LICENCE.
The author wants to clarify that SLogVIZ is not meant to serve as a total replacement of conventional log analysis tools and methods.
Please refer to the wiki.