

![]()
pyMarkovClustering is a python package for Markov Clustering (MCL) and its graph visualization. While there is already a python library markov_clustering that implements the MCL algorithm, it has not been maintained for a long time and lacks some functionality. pyMarkovClustering was developed to enable easy MCL and graph visualization from edges consisting of a list of source, target, and weight.
Note
pyMarkovClustering adjusts matrix preprocessing and parameters to achieve the same results as mcl command-line tool. This library uses scipy sparse matrix for its MCL implementation and can cluster simple graphs with a few thousand nodes without any problems. However, if you need to cluster a complex graph with tens of thousands of nodes or more, I recommend using mcl command-line tool for better runtime performance and memory efficiency.
Python 3.9 or later is required for installation.
For visualization, networkx and extra packages (e.g. matplotlib, pygraphviz) are also required.
Install PyPI package:
pip install pymarkovclustering
pip install networkx[default,extra] # For visualization
Install conda-forge package:
conda install -c conda-forge pymarkovclustering
conda install -c conda-forge networkx matplotlib-base pygraphviz pydot lxml # For visualization
Note
pygraphviz installation requires graphviz and C/C++ compiler.
If you encounter installation troubles, see pygraphviz install docs for details.
pyMarkovClustering provides a easy-to-use API to perform Markov Clustering from edges (list of source, target, weight). It also provides an API to visualize the clustering results using networkx. See notebooks and API docs in documents for more details.
import pymarkovclustering as pymcl

# List of edges (source, target, weight)
edges = [
    ("A", "B", 10),
    ("A", "C", 10),
    ("B", "C", 2),
    ("D", "E", 5),
    ("F", "G", 2),
    ("H", "I", 0.0),
]
# load edges as matrix, MCL, extract clusters
matrix, labels = pymcl.edges_to_sparse_matrix(edges)
mcl_matrix = pymcl.mcl(matrix, quiet=False)
clusters = pymcl.extract_clusters(mcl_matrix, labels)

for i, cluster in enumerate(clusters, 1):
    print(f"Cluster{i:03d}: {cluster}")
Output:
Cluster001: ['A', 'B', 'C']
Cluster002: ['D', 'E']
Cluster003: ['F', 'G']
Cluster004: ['H']
Cluster005: ['I'] import pymarkovclustering as pymcl
# Generate random edges for MCL test
edges = pymcl.random_edges(30, min_cluster_size=2, max_cluster_size=6)
print(f"Edges: {edges}\n")
# easymcl automates load edges as matrix, MCL, extract clusters
clusters = pymcl.easymcl(edges, inflation=2.0)
for i, cluster in enumerate(clusters, 1):
print(f"Cluster{i:03d}: {cluster}")Output:
Edges: [('5_2', '5_5', 0.625), ('2_1', '2_5', 0.602), ('6_4', '6_5', 0.301), ('5_3', '5_6', 0.73), ('5_2', '5_6', 0.612), ('5_3', '5_5', 0.333), ('2_3', '2_5', 0.33), ('5_1', '5_3', 0.918), ('1_2', '1_4', 0.218), ('7_1', '7_2', 0.291), ('4_2', '4_3', 0.553), ('3_1', '3_2', 0.354), ('5_3', '5_4', 0.828), ('2_2', '2_4', 0.099), ('6_2', '6_5', 0.875), ('2_1', '2_3', 0.533), ('2_1', '2_4', 0.705), ('5_4', '5_5', 0.704), ('1_1', '1_4', 0.968), ('2_2', '2_5', 0.074), ('5_1', '5_5', 0.093), ('1_2', '1_3', 0.892), ('6_2', '6_3', 0.091), ('1_3', '1_5', 0.095), ('6_2', '6_4', 0.993), ('5_2', '5_4', 0.785), ('1_1', '1_3', 0.83), ('4_3', '4_4', 0.521), ('6_1', '6_2', 0.222), ('4_1', '4_3', 0.64), ('2_3', '2_4', 0.85), ('4_1', '4_2', 0.316), ('6_1', '6_5', 0.543), ('6_3', '6_5', 0.489), ('5_1', '5_6', 0.84), ('4_1', '4_4', 0.204), ('1_3', '1_4', 0.14), ('1_2', '1_5', 0.139), ('7_1', '7_3', 0.125), ('6_1', '6_3', 0.803), ('5_4', '5_6', 0.063), ('2_2', '2_3', 0.147), ('2_1', '2_2', 0.987), ('4_2', '4_4', 0.443), ('5_2', '5_3', 0.71), ('7_2', '7_3', 0.333), ('6_3', '6_4', 0.998), ('1_4', '1_5', 0.799), ('1_1', '1_5', 0.358), ('5_1', '5_4', 0.916), ('5_1', '5_2', 0.062), ('2_4', '2_5', 0.56), ('1_1', '1_2', 0.918), ('5_5', '5_6', 0.917), ('6_1', '6_4', 0.142)]

Cluster001: ['5_2', '5_5', '5_3', '5_6', '5_1', '5_4']
Cluster002: ['2_1', '2_5', '2_3', '2_2', '2_4']
Cluster003: ['6_4', '6_5', '6_2', '6_3', '6_1']
Cluster004: ['1_2', '1_4', '1_1', '1_3', '1_5']
Cluster005: ['4_2', '4_3', '4_4', '4_1']
Cluster006: ['7_1', '7_2', '7_3']
Cluster007: ['3_1', '3_2'] import pymarkovclustering as pymcl
# Generate random edges for MCL test
edges = pymcl.random_edges(100, random_add_rate=0.1, min_cluster_size=2)
# easymclviz automates load edges as matrix, MCL, extract clusters, visualization
fig = pymcl.easymclviz(edges, inflation=2.0, show_label=True)
fig.suptitle("Markov Clustering Result Visualization")
fig.savefig("clusters.png", dpi=100)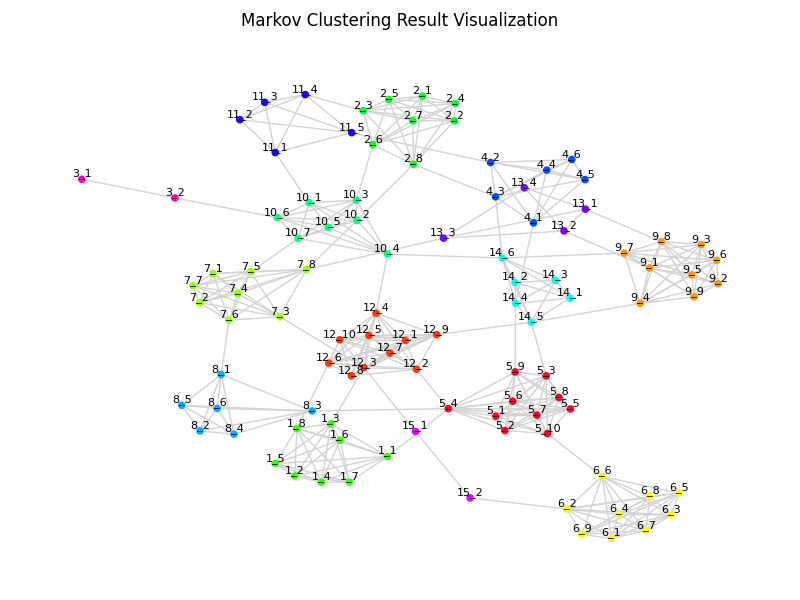
pyMarkovClustering provides simple CLI for running MCL and extract clusters from edges file.
$ pymcl --help
usage: pymcl [options] edges.tsv -o clusters.tsv

Markov Clustering in Python

positional arguments:
  edges              Input edges(source, target, weight) tab-delimited file

optional arguments:
  -o , --outfile     Output tab-delimited clusters file (default: stdout)
  -I , --inflation   Inflation factor (default: 2.0)
  --max_iter         Max number of iteration (default: 100)
  -q, --quiet        No print log on screen (default: OFF)
  -v, --version      Print version information
  -h, --help         Show this help message and exit
pymcl edges.tsv -I 2.0 -o clusters.tsv
e.g. edges.tsv >>> clusters.tsv