Hubble is a dashboard that displays in a terminal with any data you provide via http. It also allows you to setup thresholds if a number goes above/under a certain value. You can have any webhooks, programs, workers, scripts, etc just send an http post request and it will get placed on the dashboard. Be creative!!
-
To install,
git clone [email protected]:jaymedavis/hubble.gitsomewhere on your machine. Go into the hubble directory and runnpm install -
Modify config.coffee to your tastes
module.exports =
	title:  'Hubble Space Dashboard'
	border: '*'

	server:
		port: 9999

	# for more information about available options, see https://github.com/Marak/colors.js
	colors:
		title:  'green'
		border: 'grey'
		high:   'red'
		low:    'red'

columns: 2 # how many vertical columns of data for your dashboard- Run
./hubble.coffeeto start your dashboard!
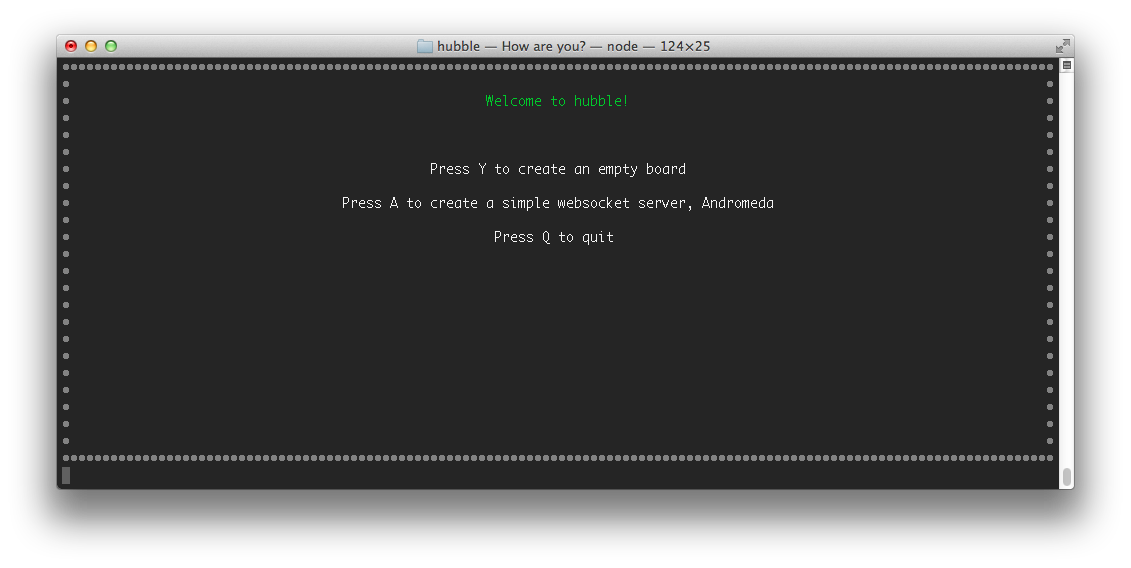
Upon your first launch of Hubble, you will see a screen like below
Hubble currently supports the following post fields:
- column - 0, 1, etc... defines which column the data goes in. (max columns are defined in config.coffee)
- label - the name of the data point to be displayed in the console
- value - the value of the data point
- high - only works with numbers. this is the over-the-threshold amount (the number will display as configured in config.coffee [red])
- low - only works with numbers. this is the below-the-threshold amount (the number will display as configured in config.coffee [also red])
Now it's time to give it some data! Since we configured it to have two columns, lets put some data in each.
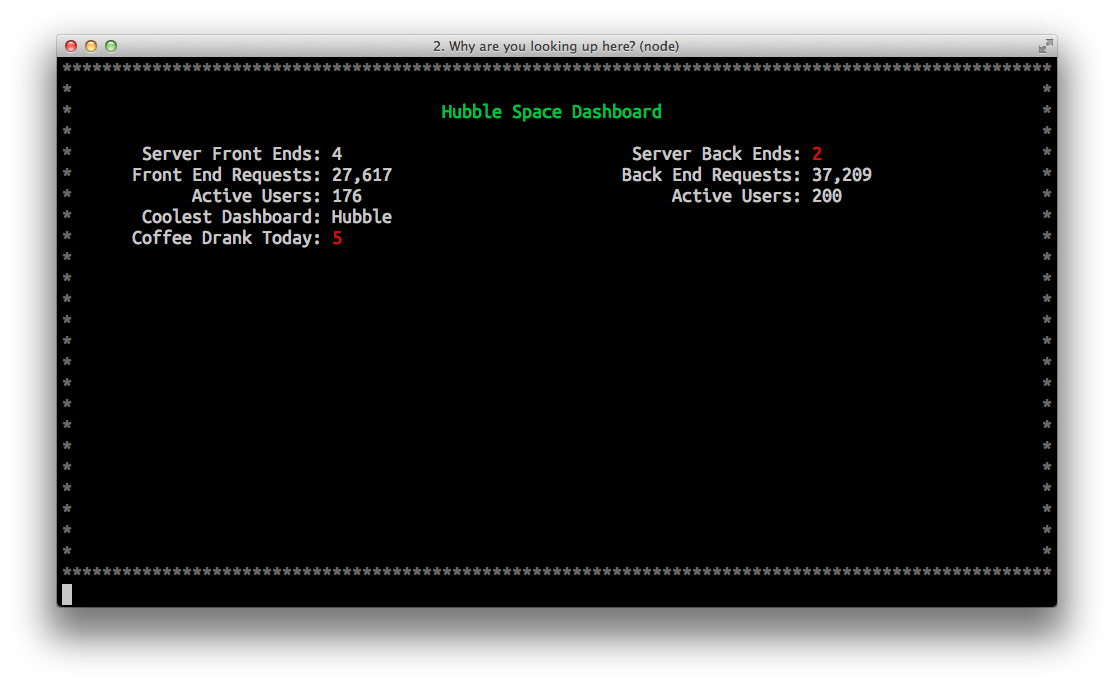
Let's post how many front end and back end servers we have running. If we go under 3, we want it to display the color of the low threshold (red). Let's also post some other random data.
curl --data "column=0&label=Server%20Front%20Ends&value=4&low=3" http://localhost:9999/
curl --data "column=1&label=Server%20Back%20Ends&value=2&low=3"  http://localhost:9999/

curl --data "column=0&label=Front%20End%20Requests&value=27,617" http://localhost:9999/
curl --data "column=1&label=Back%20End%20Requests&value=37,209"  http://localhost:9999/

curl --data "column=0&label=Active%20Users&value=176" http://localhost:9999/
curl --data "column=1&label=Active%20Users&value=200" http://localhost:9999/

curl --data "column=0&label=Coolest%20Dashboard&value=Hubble"  http://localhost:9999/
curl --data "column=0&label=Coffee%20Drank%20Today&value=5&high=4" http://localhost:9999/
After adding some data, setting some thresholds, the dashboard will now look like below

