You will scan all geotagged tweets sent in 2020 to monitor for the spread of the coronavirus on social media.
Due date: Sunday, 5 March
This homework will require lots of computation time. I recommend that you have your code working by 12 Feb to ensure that you will have enough time to execute the code.
Learning Objectives:
- work with large scale datasets
- work with multilingual text
- use the MapReduce divide-and-conquer paradigm to create parallel code
Approximately 500 million tweets are sent everyday.
Of those tweets, about 2% are geotagged.
That is, the user's device includes location information about where the tweets were sent from.
The lambda server's /data/Twitter dataset folder contains all geotagged tweets that were sent in 2020.
In total, there are about 1.1 billion tweets in this dataset.
The tweets are stored as follows.
The tweets for each day are stored in a zip file geoTwitterYY-MM-DD.zip,
and inside this zip file are 24 text files, one for each hour of the day.
Each text file contains a single tweet per line in JSON format.
JSON is a popular format for storing data that is closely related to python dictionaries.
Vim is able to open compressed zip files, and I encourage you to use vim to explore the dataset.
You will follow the MapReduce procedure to analyze these tweets. This is a 3 step procedure summarized in the following image:

I have already done the partition step for you (by splitting up the tweets into one file per day). You will have to do the map and reduce steps.
Complete the following tasks to familiarize yourself with the sample code:
-
Fork the twitter_coronavirus repo and clone it onto the lambda server.
-
Mapping: The
map.pyfile processes the zip file for an individual day. From the root directory of your clone, run the command$ ./src/map.py --input_path=/data/Twitter\ dataset/geoTwitter20-02-16.zipThis command will take a few minutes to run as it is processing all of the tweets within the zip file. After the command finishes, you will now have a folder
outputsthat contains a file/geoTwitter20-02-16.zip.lang. This is a file that contains JSON formatted information summarizing the tweets from 16 February. -
Visualizing: The
visualize.pyfile displays the output from running themap.pyfile. Run the command$ ./src/visualize.py --input_path=outputs/geoTwitter20-02-16.zip.lang --key='#coronavirus'This displays the total number of times the hashtag
#coronaviruswas used on 16 February in each of the languages supported by twitter. Now manually inspect the output of the.langfile using vim:$ vim outputs/geoTwitter20-02-16.zip.langYou should see that the file contains a dictionary of dictionaries. The outermost dictionary has languages as the keys, and the innermost dictionary has hashtags as the keys. The
visualize.pyfile simply provides a nicer visualization of these dictionaries. -
Reducing: The
reduce.pyfile merges the outputs generated by themap.pyfile so that the combined files can be visualized. Generate a new output file by running the command$ ./src/map.py --input_path=/data/Twitter\ dataset/geoTwitter20-02-17.zipThen merge these output files together by running the command
$ ./src/reduce.py --input_paths outputs/geoTwitter20-02-16.zip.lang outputs/geoTwitter20-02-17.zip.lang --output_path=reduced.langAlternatively, you can use the glob to merge all output files with the command
$ ./src/reduce.py --input_paths outputs/geoTwitter*.lang --output_path=reduced.langNow you can visualize the
reduced.langfile with the command$ ./src/visualize.py --input_path=reduced.lang --key='#coronavirus'and this displays the combined result.
Complete the following tasks:
Task 1: Map
Modify the map.py file so that it tracks the usage of the hashtags on both a language and country level.
This will require creating a variable counter_country similar to the variable counter_lang,
and modifying this variable in the #search hashtags section of the code appropriately.
The output of running map.py should be two files now, one that ends in .lang for the language dictionary (same as before),
and one that ends in .country for the country dictionary.
HINT: Most tweets contain a
placekey, which contains a dictionary with thecountry_codekey. This is how you should lookup the country that a tweet was sent from. Some tweets, however, do not have acountry_codekey. This can happen, for example, if the tweet was sent from international waters or the international space station. Your code will have to be generic enough to handle edge cases similar to this without failing.
Task 2: Reduce
Once your map.py file has been modified to track results for each country,
you should run the map file on all the tweets in the /data/Twitter\ dataset folder from 2020.
HINT: Use the glob
*to select only the tweets from 2020 and not all tweets.
You should create a shell script run_maps.sh that loops over each file in the dataset and runs map.py on that file.
Each call to map.py can take up to a day to finish, so you should use the nohup command to ensure the program continues to run after you disconnect and the & operator to ensure that all map.py commands run in parallel.
After your modified map.py has run on all the files,
you should have a large number of files in your outputs folder.
Use the reduce.py file to combine all of the .lang files into a single file,
and all of the .country files into a different file.
Task 3: reduce
Recall that you can visualize your output files with the command
$ ./src/visualize.py --input_path=PATH --key=HASHTAG
Currently, this prints the top keys to stdout.
Modify the visualize.py file so that it generates a bar graph of the results and stores the bar graph as a png file.
The horizontal axis of the graph should be the keys of the input file,
and the vertical axis of the graph should be the values of the input file.
The final results should be sorted from low to high, and you only need to include the top 10 keys.
HINT: We are not covering how to create images from python code in this class. I recommend you use the matplotlib library, and you can find some samples to base your code off of in the documentation here.
Then, run the visualize.py file with the --input_path equal to both the country and lang files created in the reduce phase, and the --key set to #coronavirus and #코로나바이러스.
This should generate four plots in total.
Task 4: uploading
Commit all of your code and images output files to your github repo and push the results to github.
You must edit the README.md file to provide a brief explanation of your results and include the 4 generate png files.
This explanation should be suitable for a future employer to look at while they are interviewing you to get a rough idea of what you accomplished.
(And you should tell them about this in your interviews!)
These are four of the png images that were generated. They analyze the usage of #coronavirus and #코로나바이러스 in different countries and languages. The visualizations of other hashtags are also contained in the plots folder. To automate the generation of these graphs, I created a shell script run_viz.sh that loops through each hashtag. It runs the visualize.py file based on the hashtag we are analyzing as well as whether we are looking at countries or languages. I checked that these ran correctly by storing the output in vizcheck/"$file"."$hashtag", which displays the hashtag the plot is being generated for as well as the top 10 countries/languages it is used in.
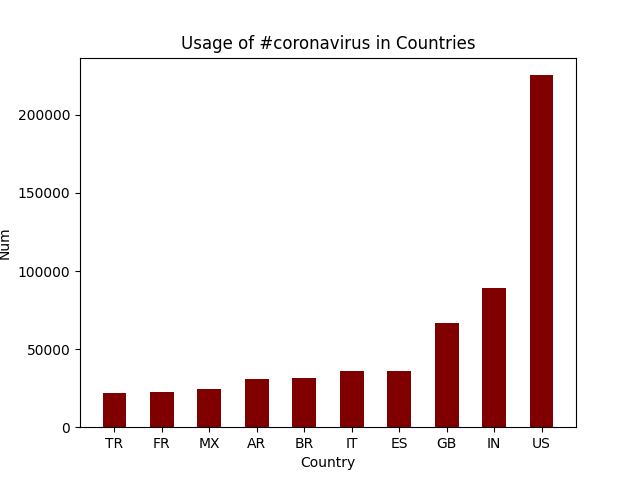
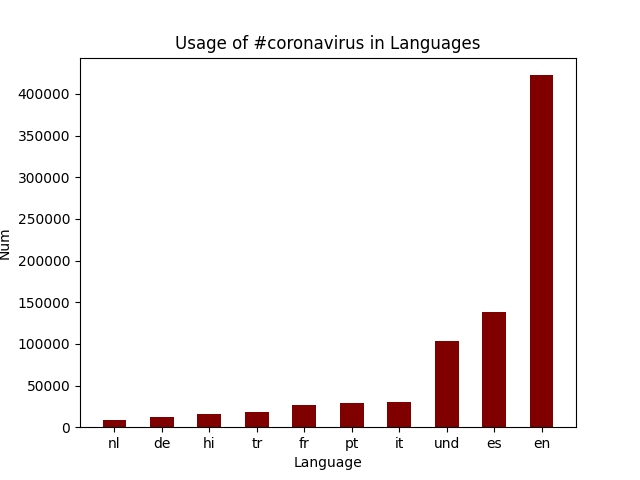
#coronavirus was used most frequently in the US, and the most common language it was tweeted in was English.
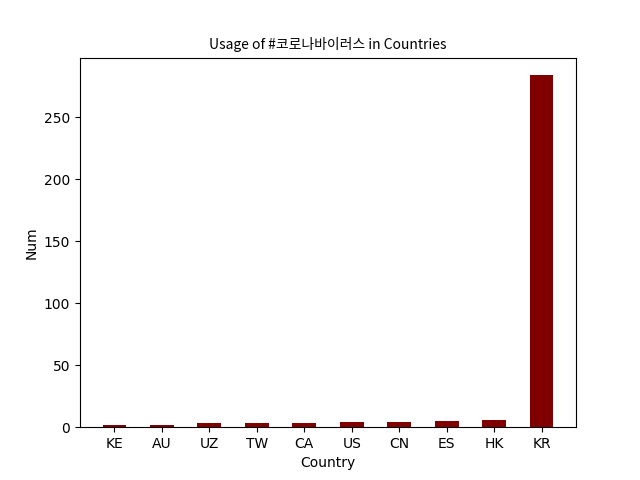

#코로나바이러스 was used most frequently in Korea, and the most common language it was tweeted in was Korean.
Upload a link to you github repository on sakai. I will look at your code and visualization to determine your grade.
Notice that we are not using CI to grade this assignment. There's two reasons:
- You can get slightly different numbers depending on some of the design choices you make in your code.
For example, should the term
coronacount tweets that containcoronavirusas well as tweets that contain justcorona? These are relatively insignificant decisions. I'm more concerned with your ability to write a shell script and usenohup,&, and other process control tools effectively.