-
Notifications
You must be signed in to change notification settings - Fork 1
MainDialog
The main dialog is the main entry point to the program; all functions of the program is directly or indirectly accessible from the main dialog.
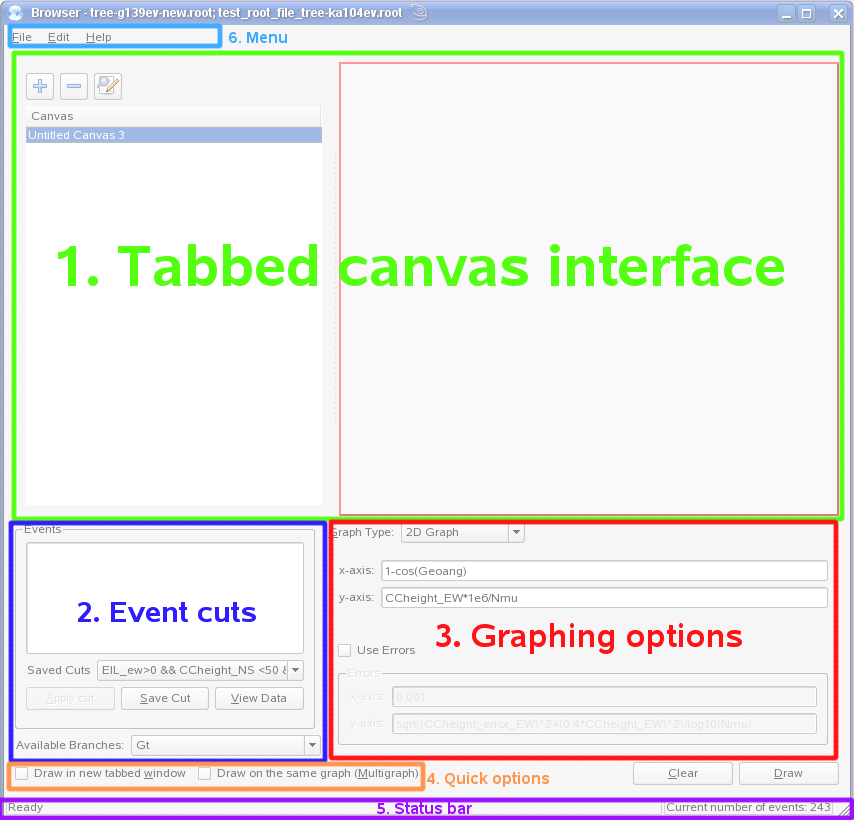
The main dialog is divided into a few parts:

On the left, the canvases are shown in a columns, and by clicking a name in the column, the corresponding canvas should show up on the right.
At any time, you can click the  button to add a new canvas, which will give you a completely clean canvas on which to draw graphs. If any canvas are no longer needed, you can remove it by clicking on the
  button. And finally, you can rename the canvas to a more descriptive name by clicking the
  button.
The canvases you created can be exported to a text file then later imported back by the program for further editing, To export, go to menu File -> Export Canvases, and to import, go to menu File -> Import Canvases. All canvases can also be saved in other formats such as postscript, pdf, images, etc.; to do so, go to menu File -> Save As or File -> Save All As.
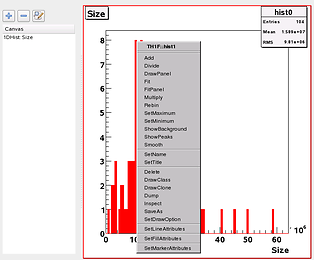
By right clicking on the various parts (such as the axis, the title, the plots, etc.) on the canvas itself, you can have access to some ROOT function to modify the attributes of the graph such as color, marker type, etc.:

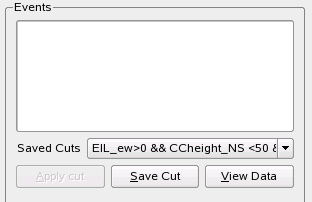
The apply a cut, enter a cut in the textbox and click "Apply Cut". If you click "Save Cut", the event cut in the textbox will be saved, and you will be able to access the saved cuts by finding them in the drop-down list "Saved cuts". Additionally, the entries in "Saved cuts" are saved in a file called eventcuts.txt so that next time the program starts the saved cuts are recovered. See ConfigSettingFiles, section eventcuts.txt for more explanation.
Notice that the "Apply cut" button is greyed out after applying the cut, signifying that the cut has been applied, and also notice that the number of events after cut is displayed in the lower right hand corner in the status bar.
By clicking the "View Data" button, you will be directed to a new dialog which contains a table that shows the data in the ROOT tree. See ViewDataInRootTree for more information.
The branches available in the ROOT tree are shown in the lower left hand corner in a drop-down list:

Whenever the input focus is on a textbox, one can select a branch from the drop-down list, and the name of the branch will be automatically inserted into the textbox to minimize typing errors (remember the branch name is case-sensitive!).
At the top of this part you will find a drop-down list of the graph types available, and by selecting one of the options you will be shown various input boxes to enter information. See GraphingExamples for more information on each of the graph types.
Here you have two options:
- Draw in new tabbed window: by checking this checkbox, each time you click the button "Draw", a new tab will be created automatically for you containing the new graph. If the checkbox is not checked, the button "Draw" will draw and overwrite the current canvas.
- Draw multiple graphs on the same canvas: by checking this checkbox, each time you click the button "Draw", the graph will be drawn on top of the current canvas; if the checkbox is unchecked, the current canvas is by default erased before the new graph is drawn.
On the left is some information about the status of the program; on the left, the current number of events is shown.
The options are:
-
File - New Tab: create a new tab
-
File - Open: open new ROOT files
-
File - Save: save the current canvas in various formats
-
File - Save All As: save all canvases in various formats
- Single File: all canvases are combined in a single .ps or.eps file
- Separate Files: each canvases are saved in an individual file in format and in the folder chosen by the user.
-
File - Import/Export canvases: import or export all canvases in a text config files. See ConfigSettingFiles, section Canvas Defition file, for more information.
-
File - Print: does not do anything at this moment.
-
File - Exit: exit the program.
-
Edit - Divide Canvas: suppose to divide the current canvas into pads; but the functionality is not yet implemented.
-
Tools - View data in ROOT tree: show the View Data dialog.
-
Help - About: shows information about the program.
