Scalability Evaluation Results
Back to Scalability Evaluation main page
We have run two series of measurements, the first used a small initial model (Ping-Pong) which was scaled up to both higher number components and more complex component internals, while the second used the EATF input model which was scaled up to multiple components by copying the original.
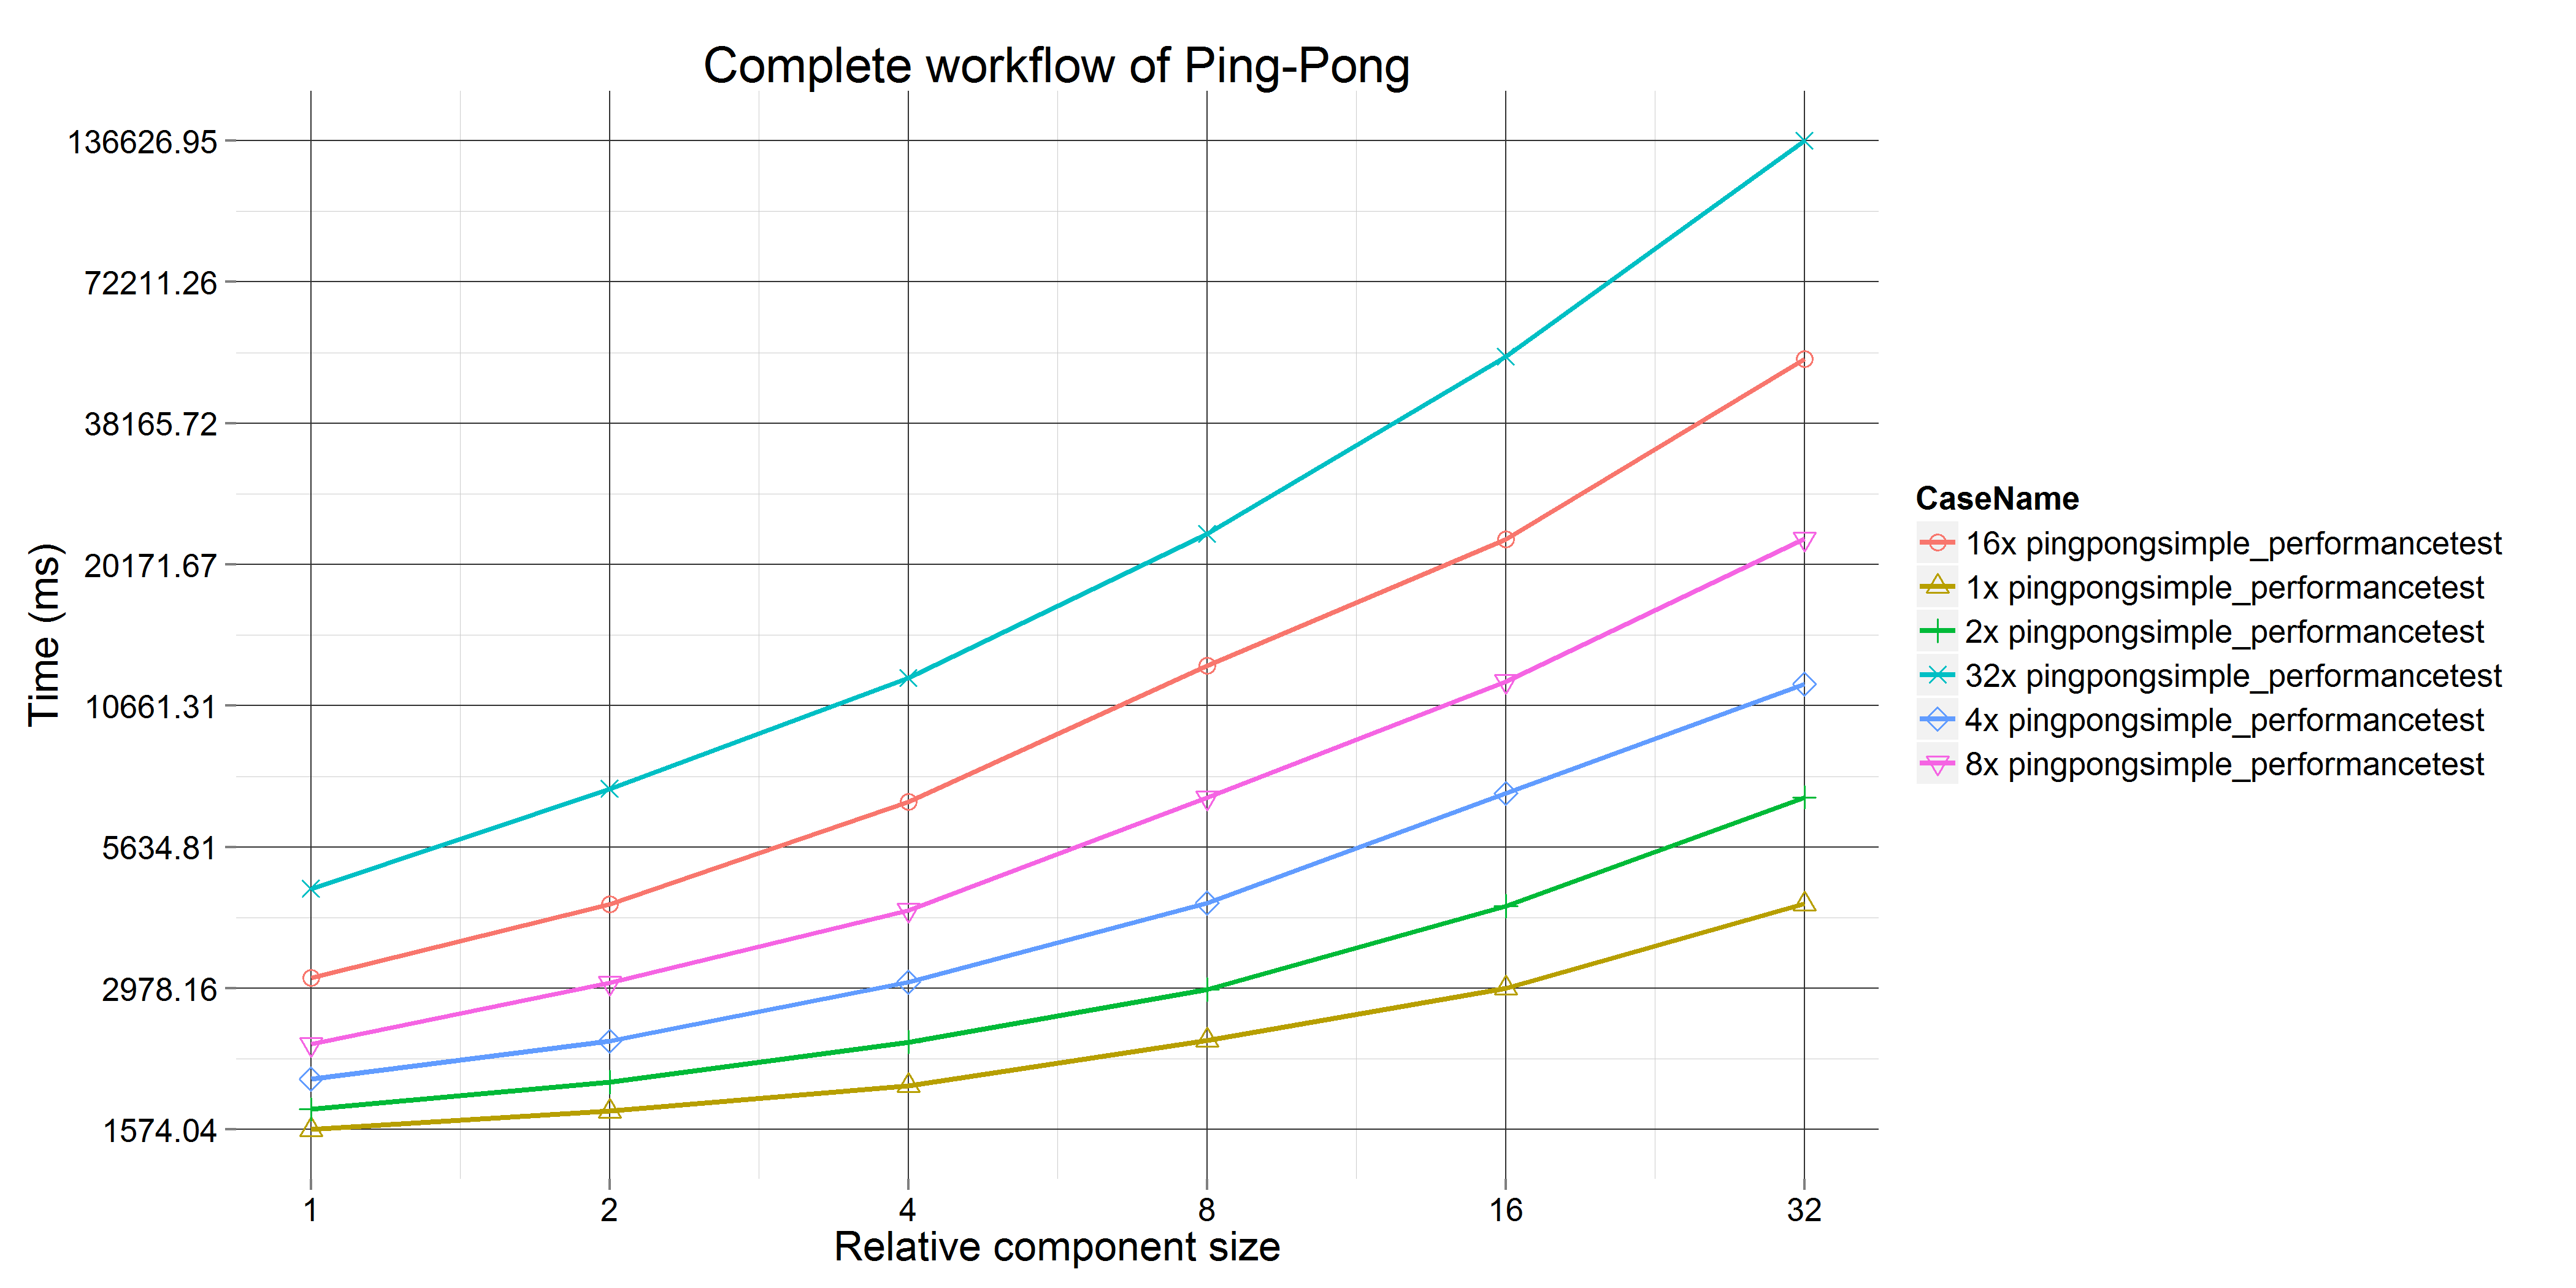
The following graph shows the total runtime of the complete Model Compiler workflow as defined by the simple run scenario.
The results corresponding to a given series (e.g. 4x pingpongsimple) all use models that contain the same number of components (4 in this example), while the size of components are used as the X axis. Note that on all graphs, both axes use log2 scales.
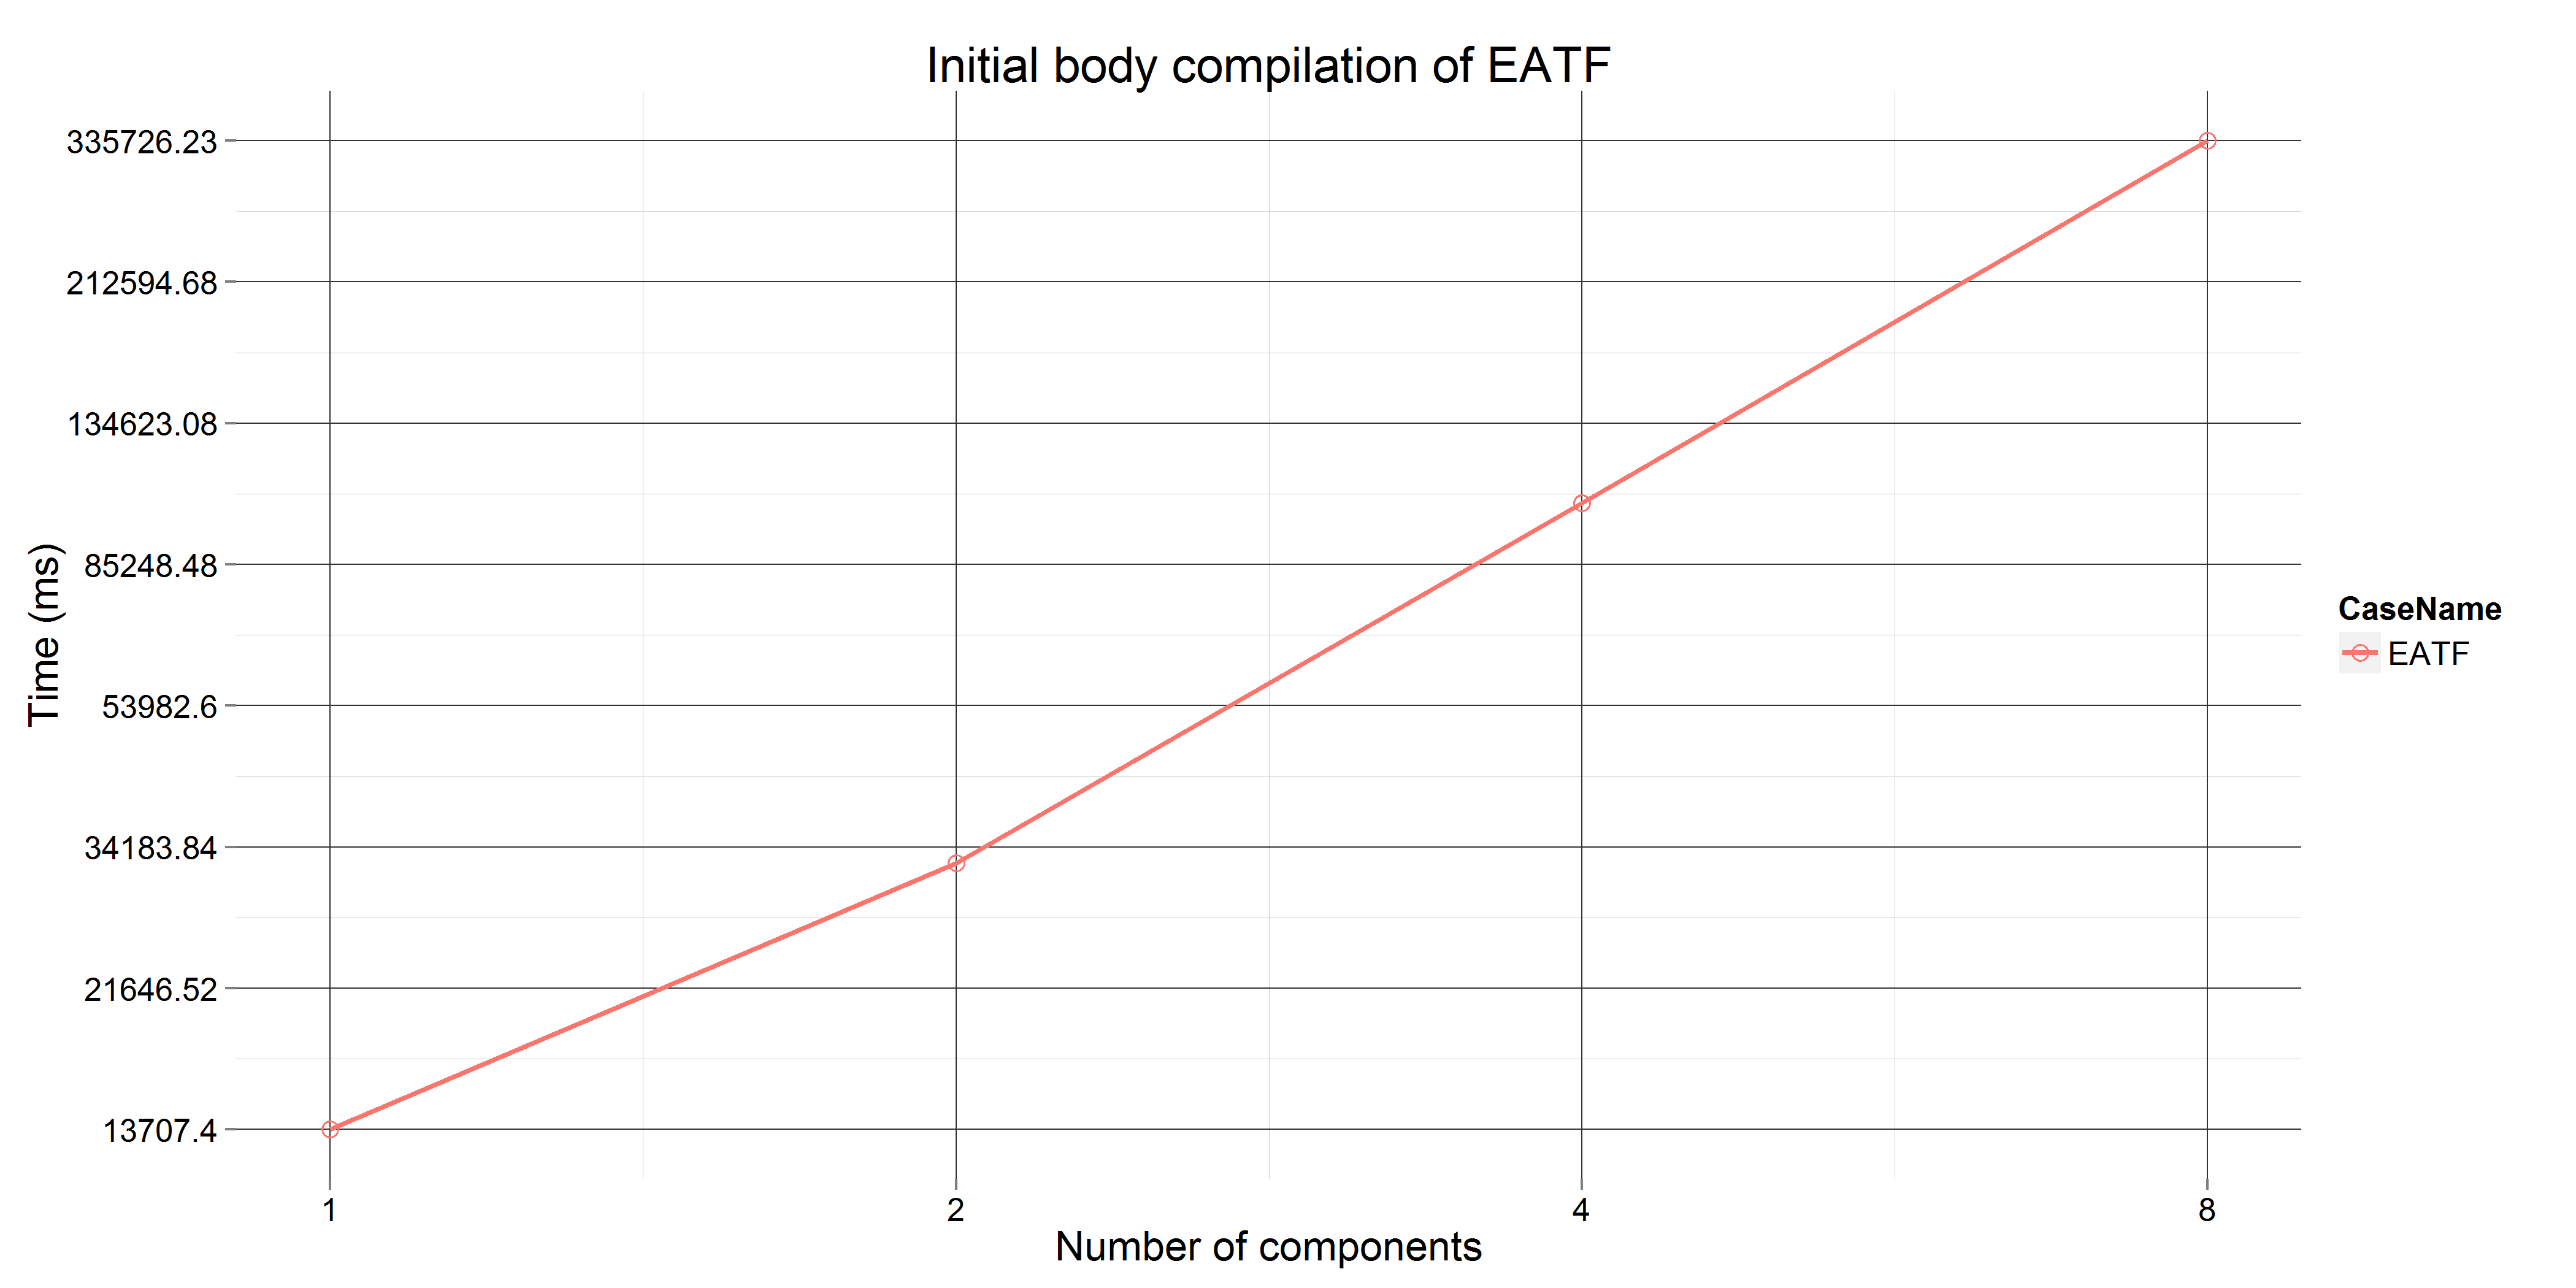
The next figure shows the same series but with only the runtime of compiling the rALF action codes in all components. You can clearly see that the majority of the time is spent in this phase (114 out of 136 seconds in the largest case). This means that in the current version, rALF compilation is the bottleneck. We identified several factors in the rALF compilation process that can be improved later to speed up this phase.

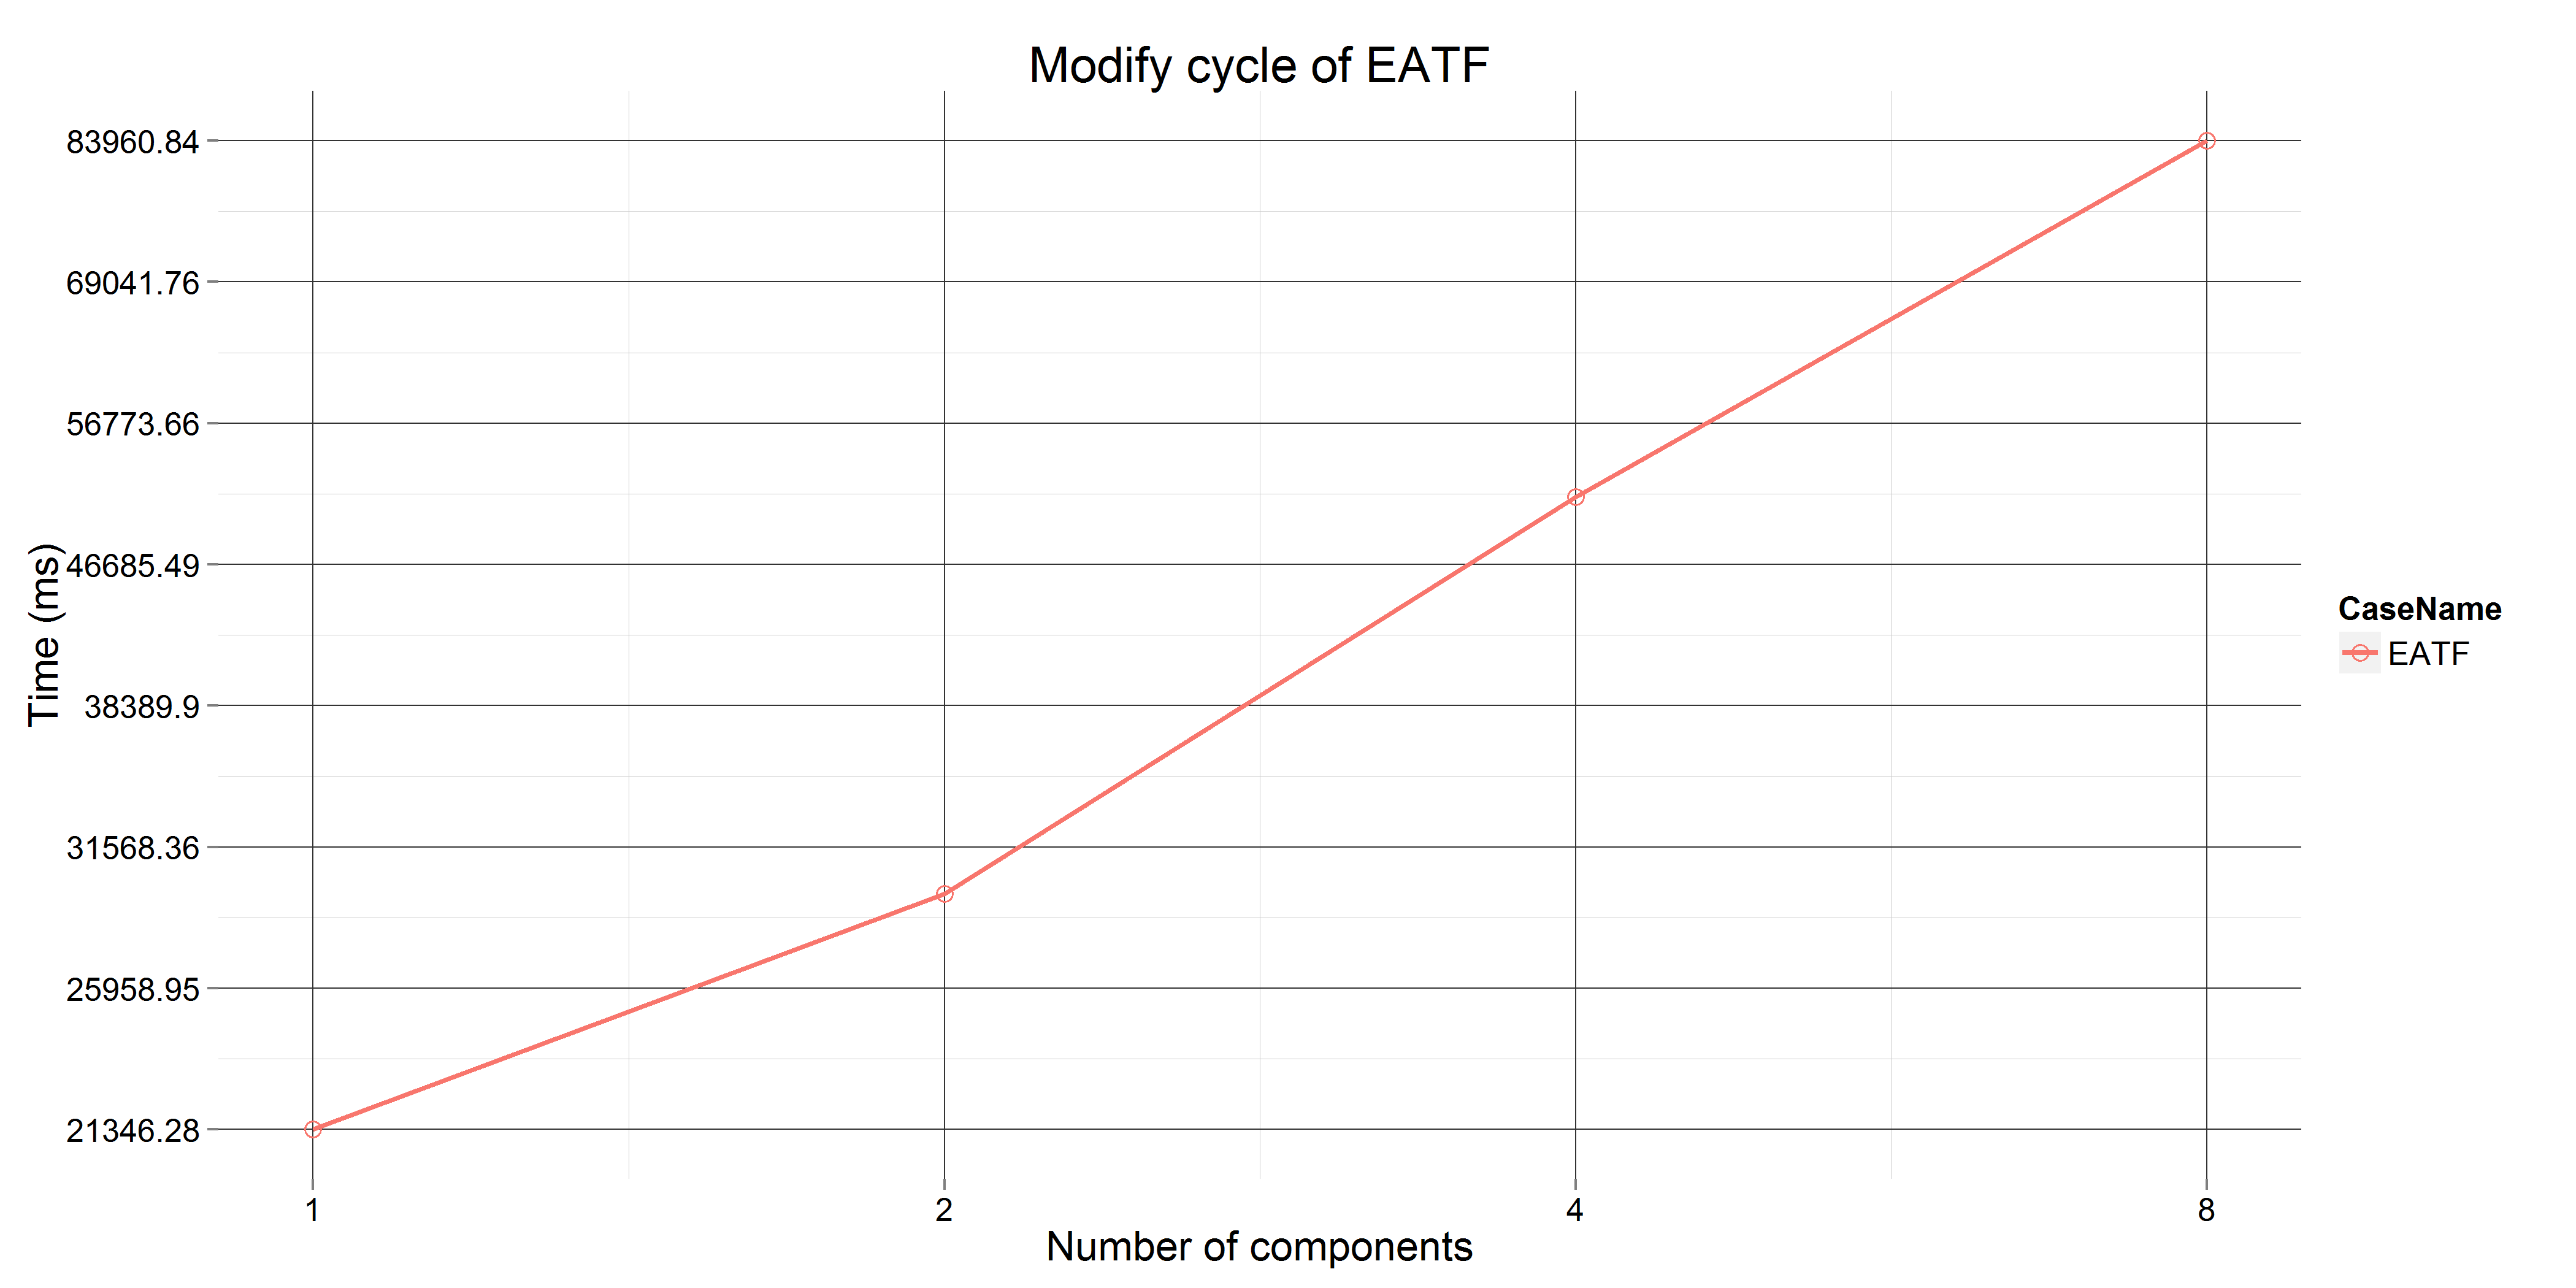
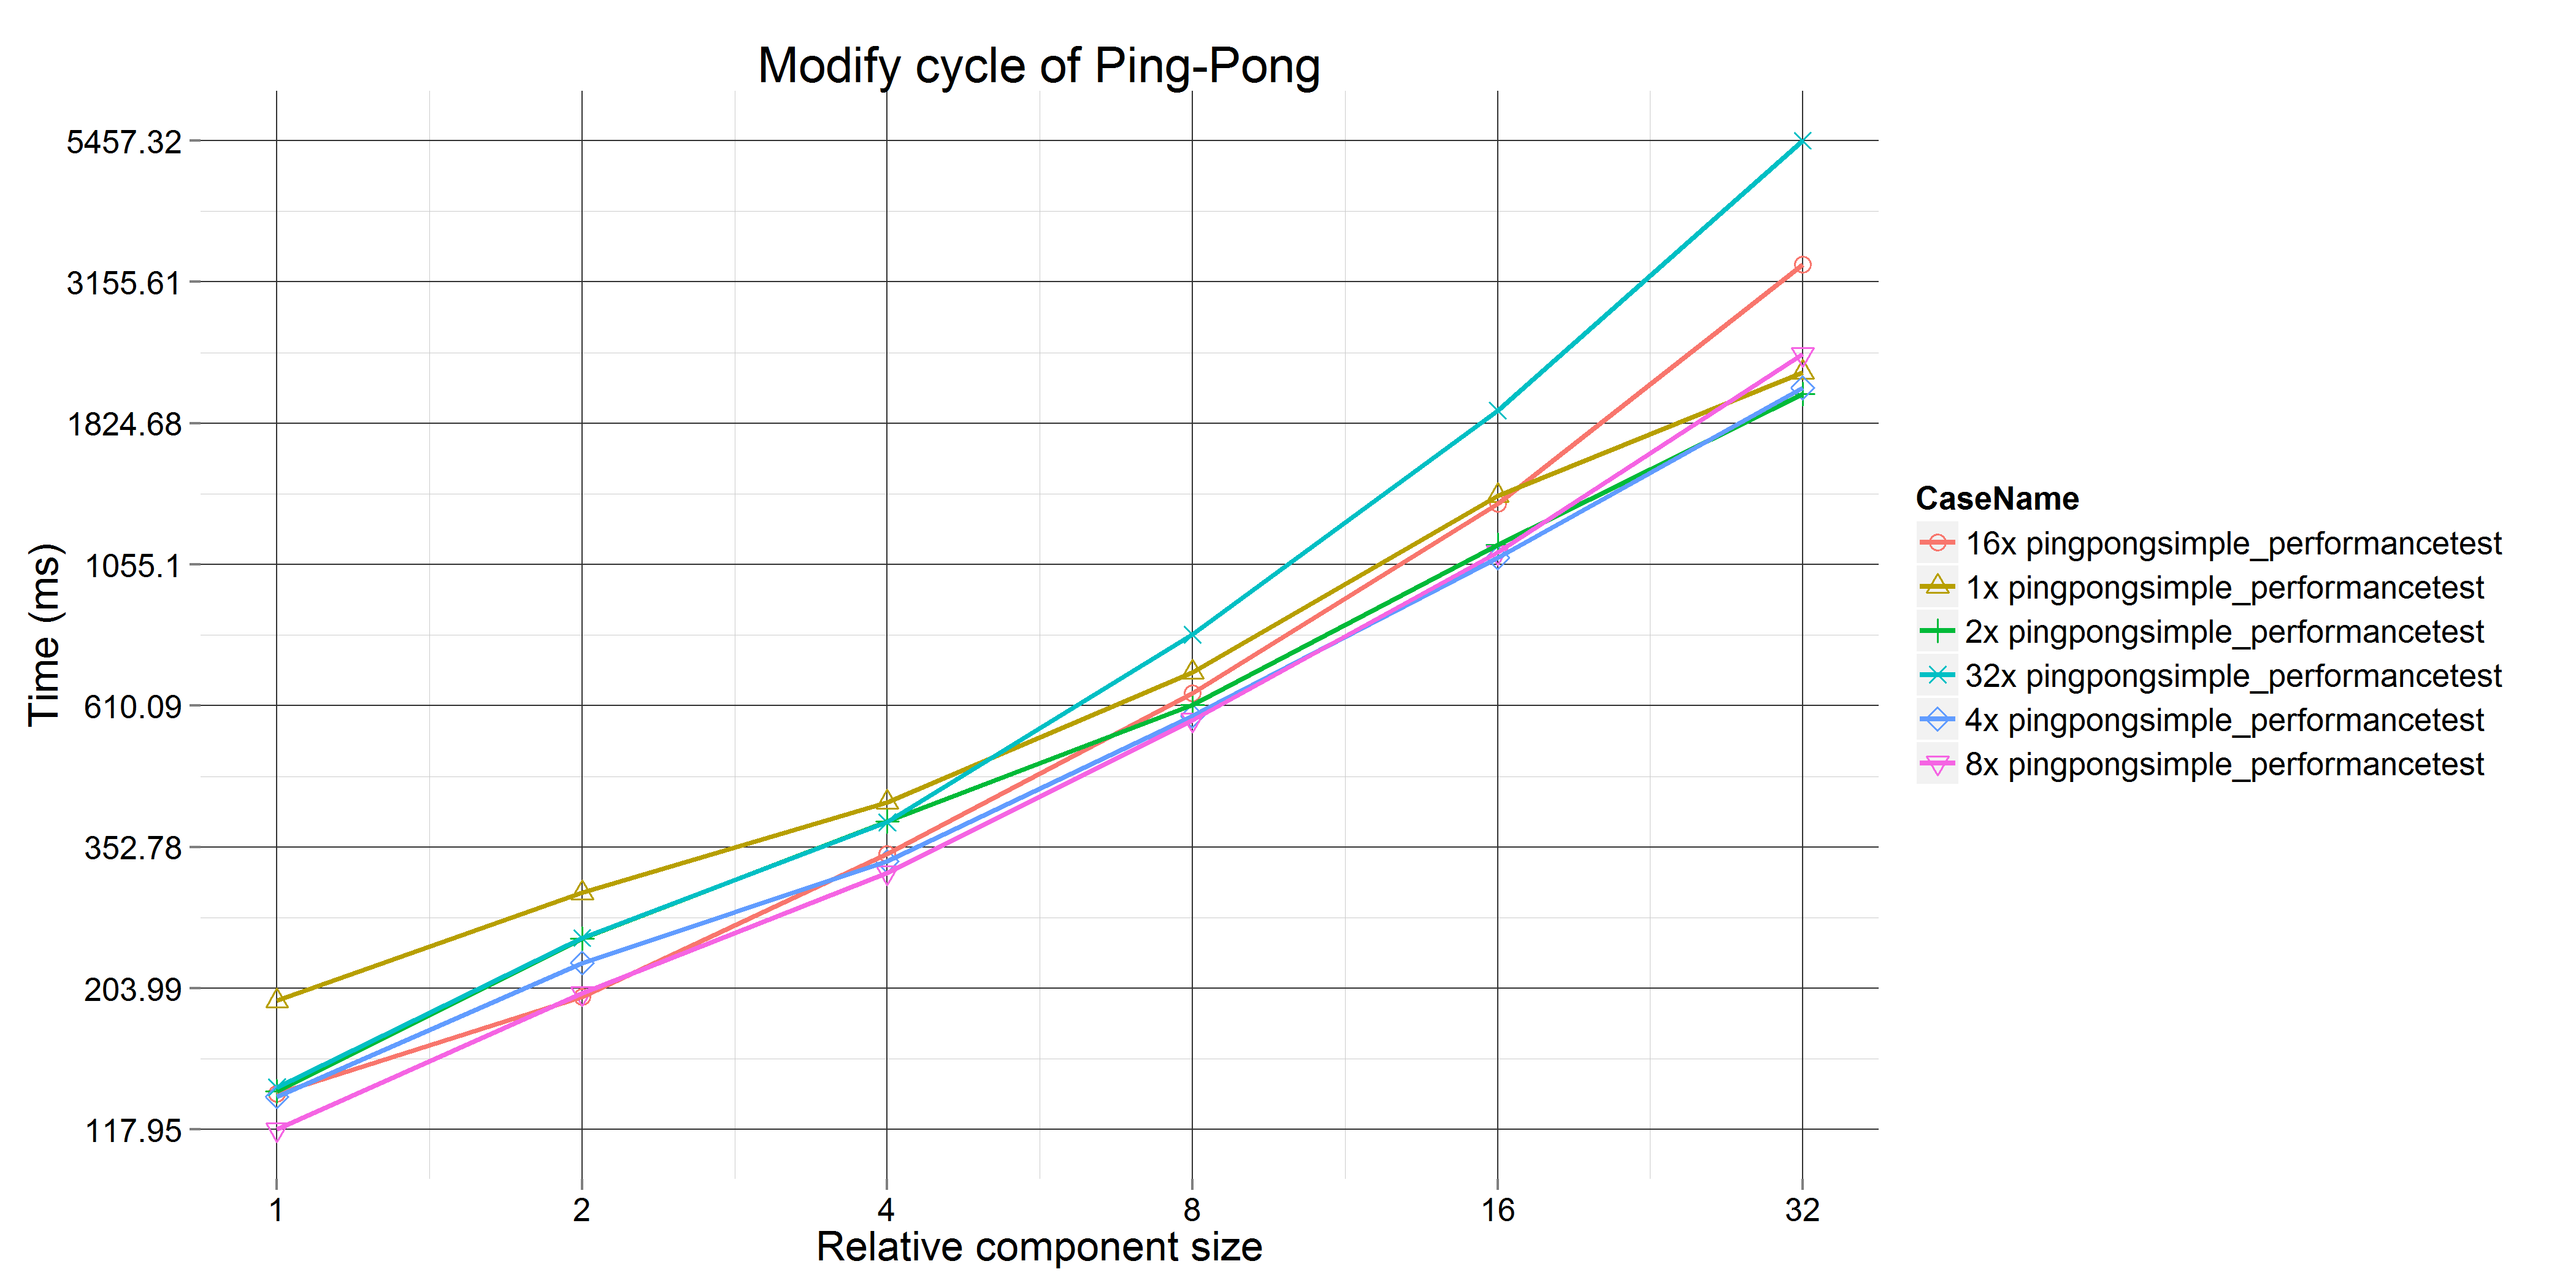
We have also measured the incremental performance of the model compiler as defined in the run with modification scenario. The figure below shows the total runtime for a single Modification cycle, where the modification involved changing the internal structure of a single component. In this case, only the modified component is compiled again. It is clear that such incrementality is very efficient for models with multiple components.
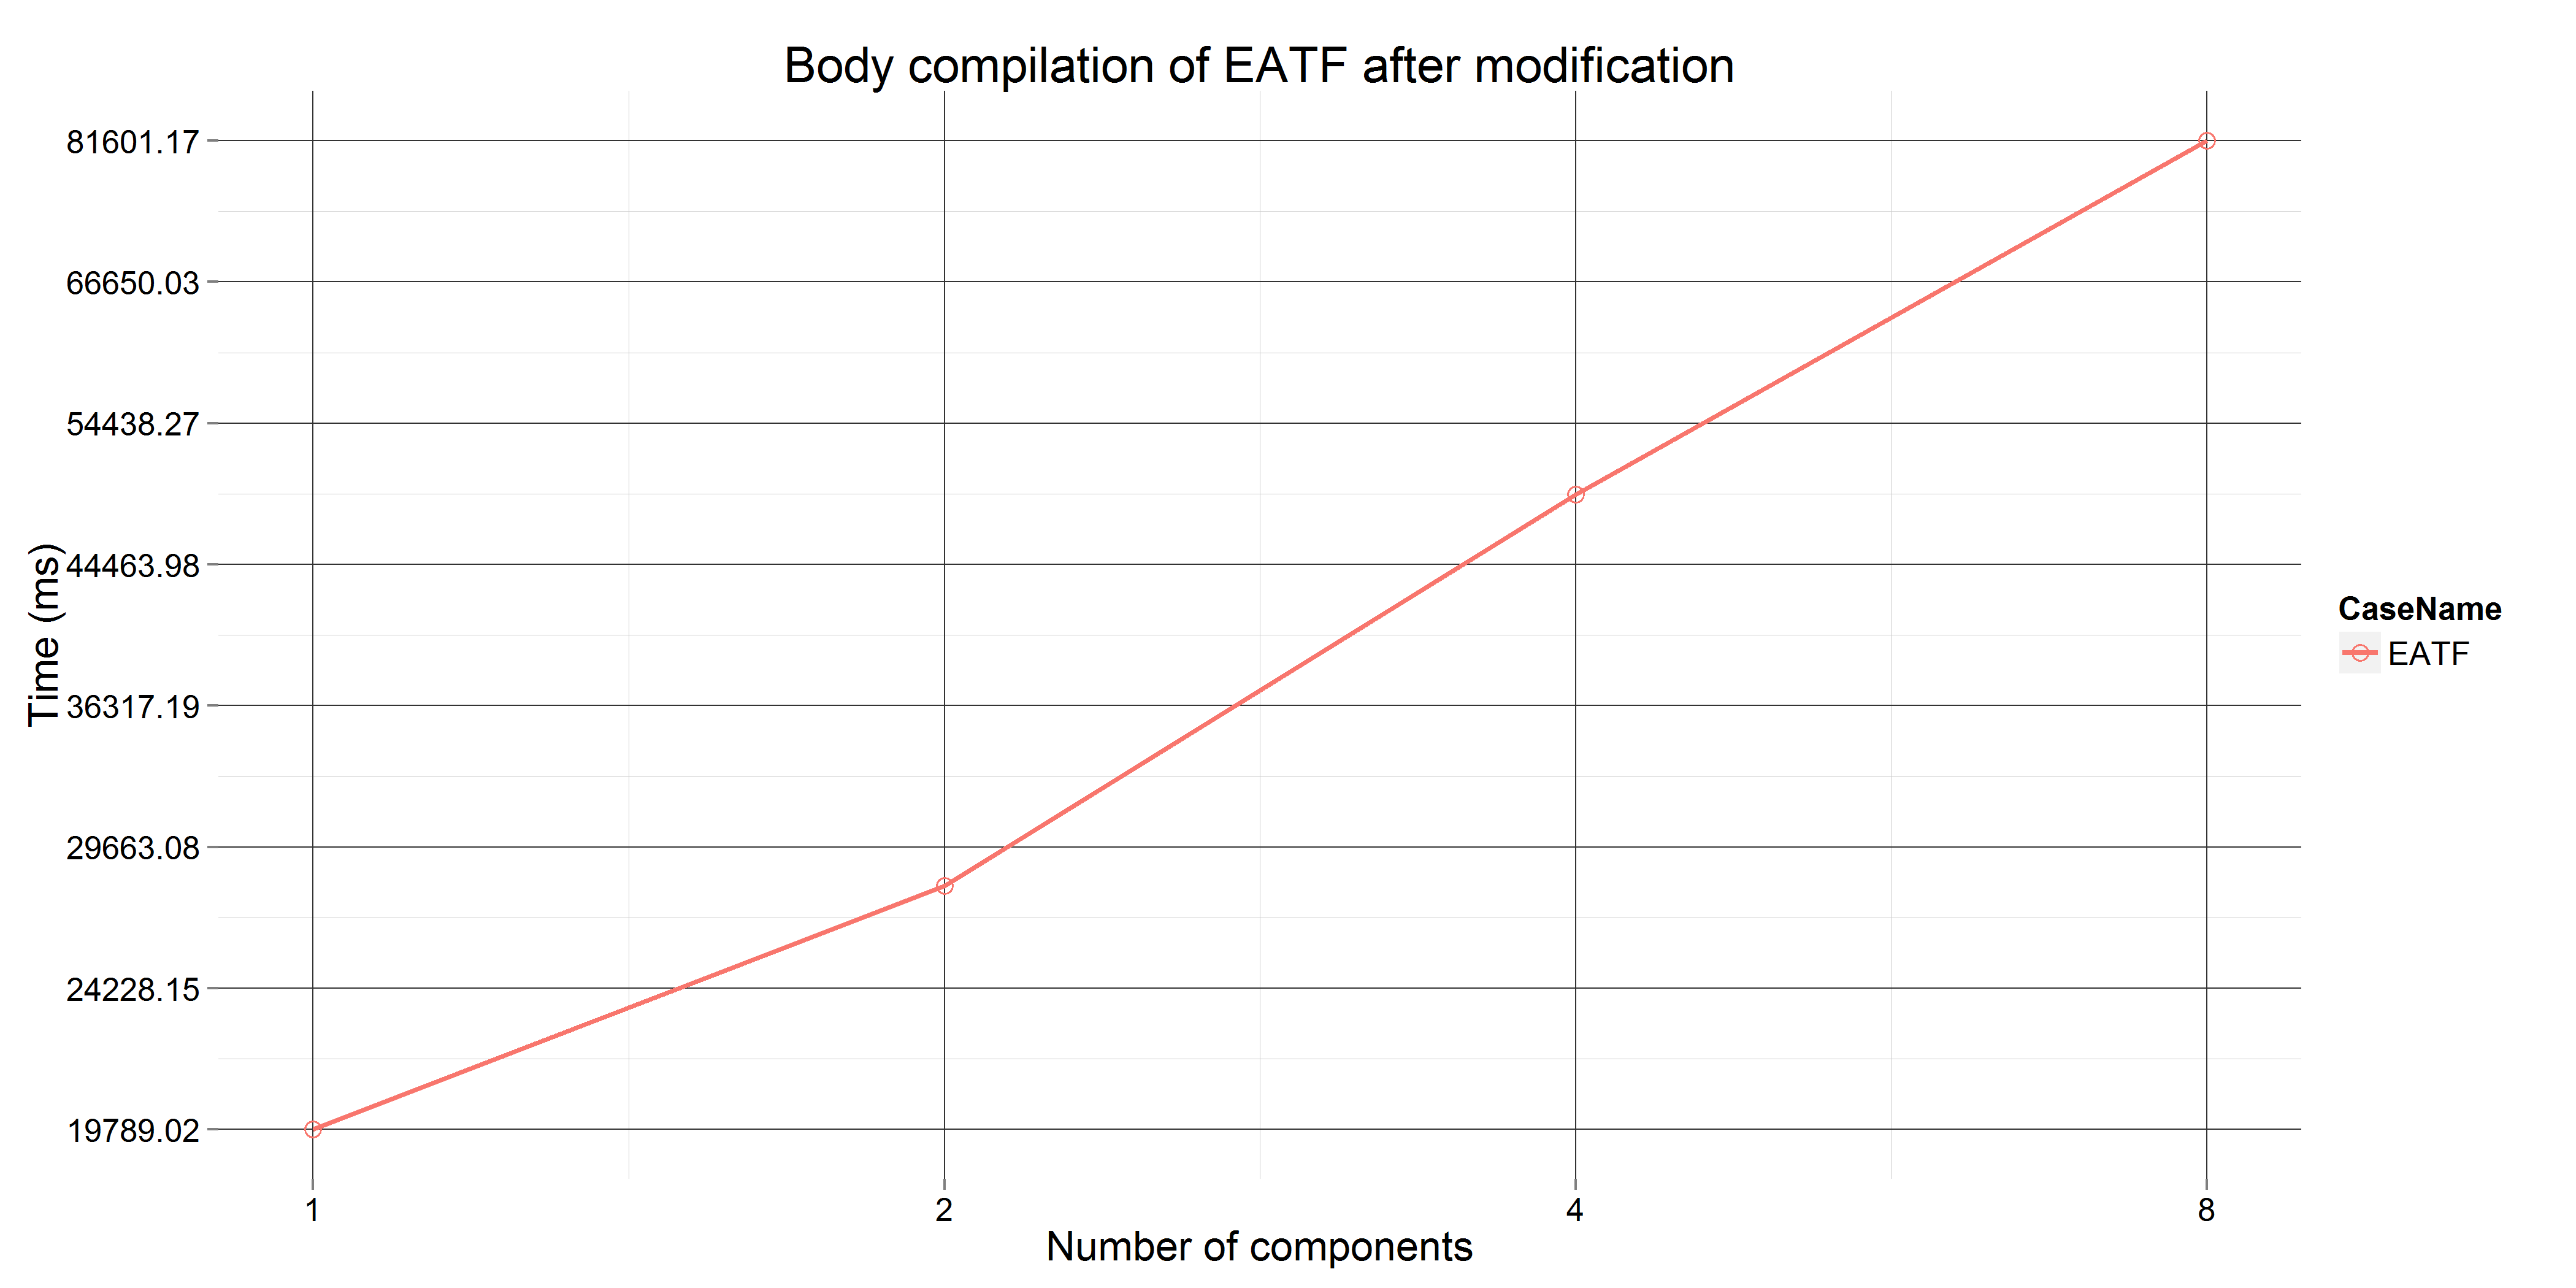
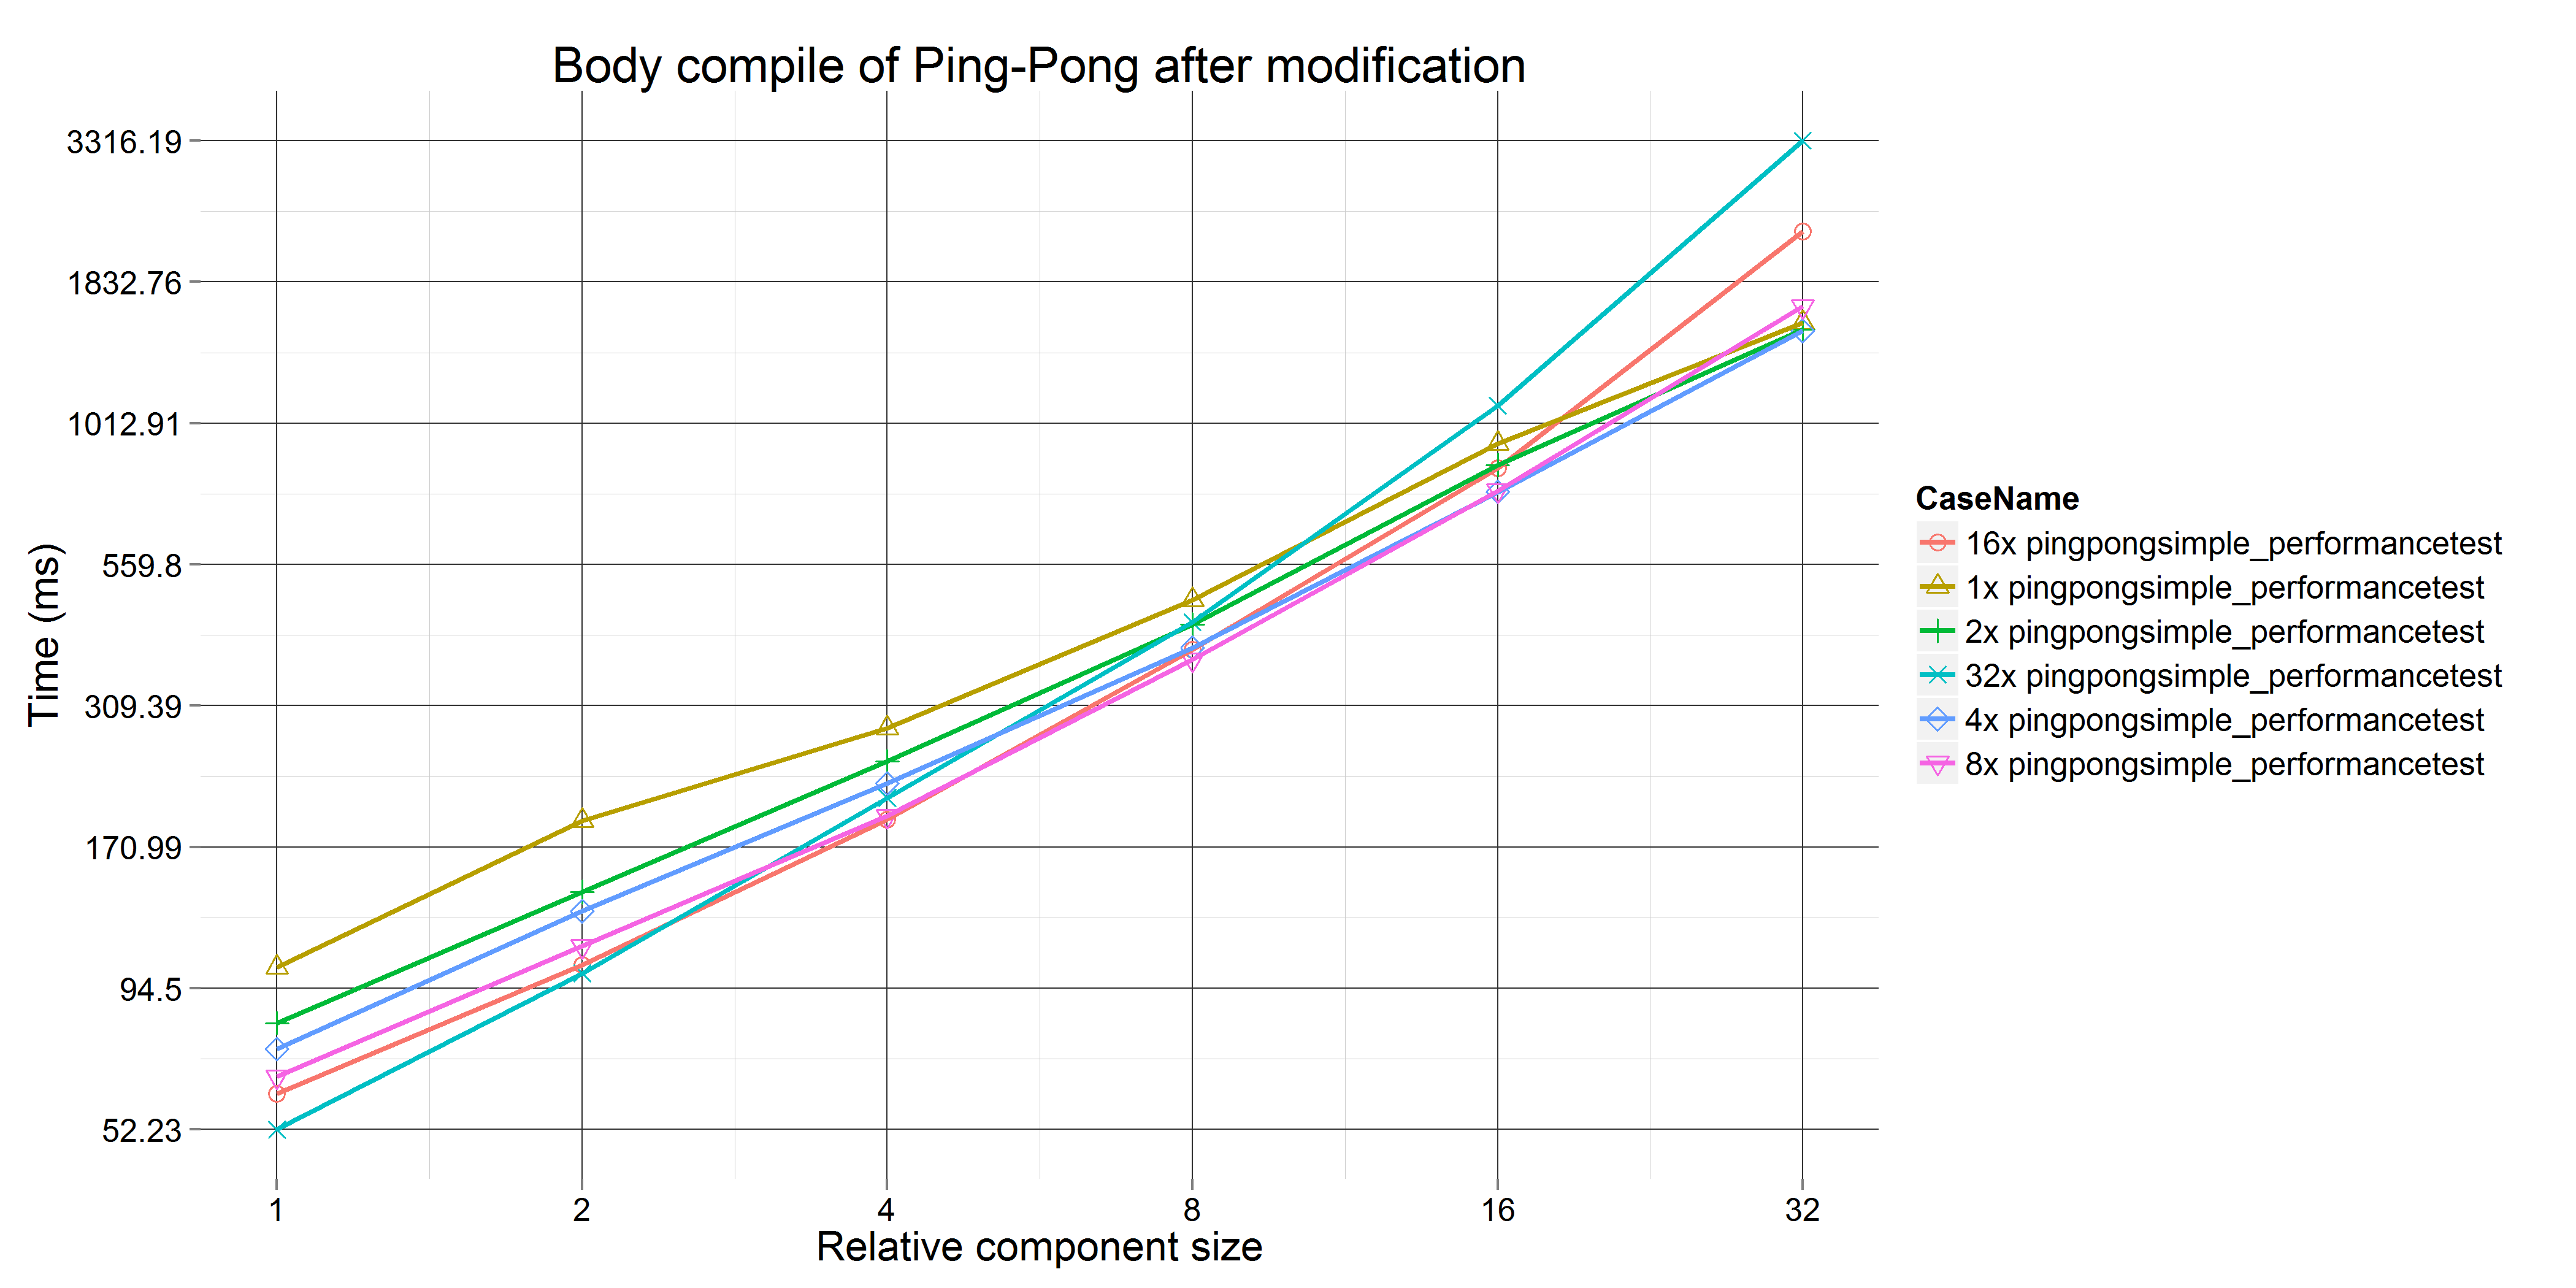
As before, we provide the runtime results for the rALF code compilation only, to show that it takes up a considerable time in this case as well.
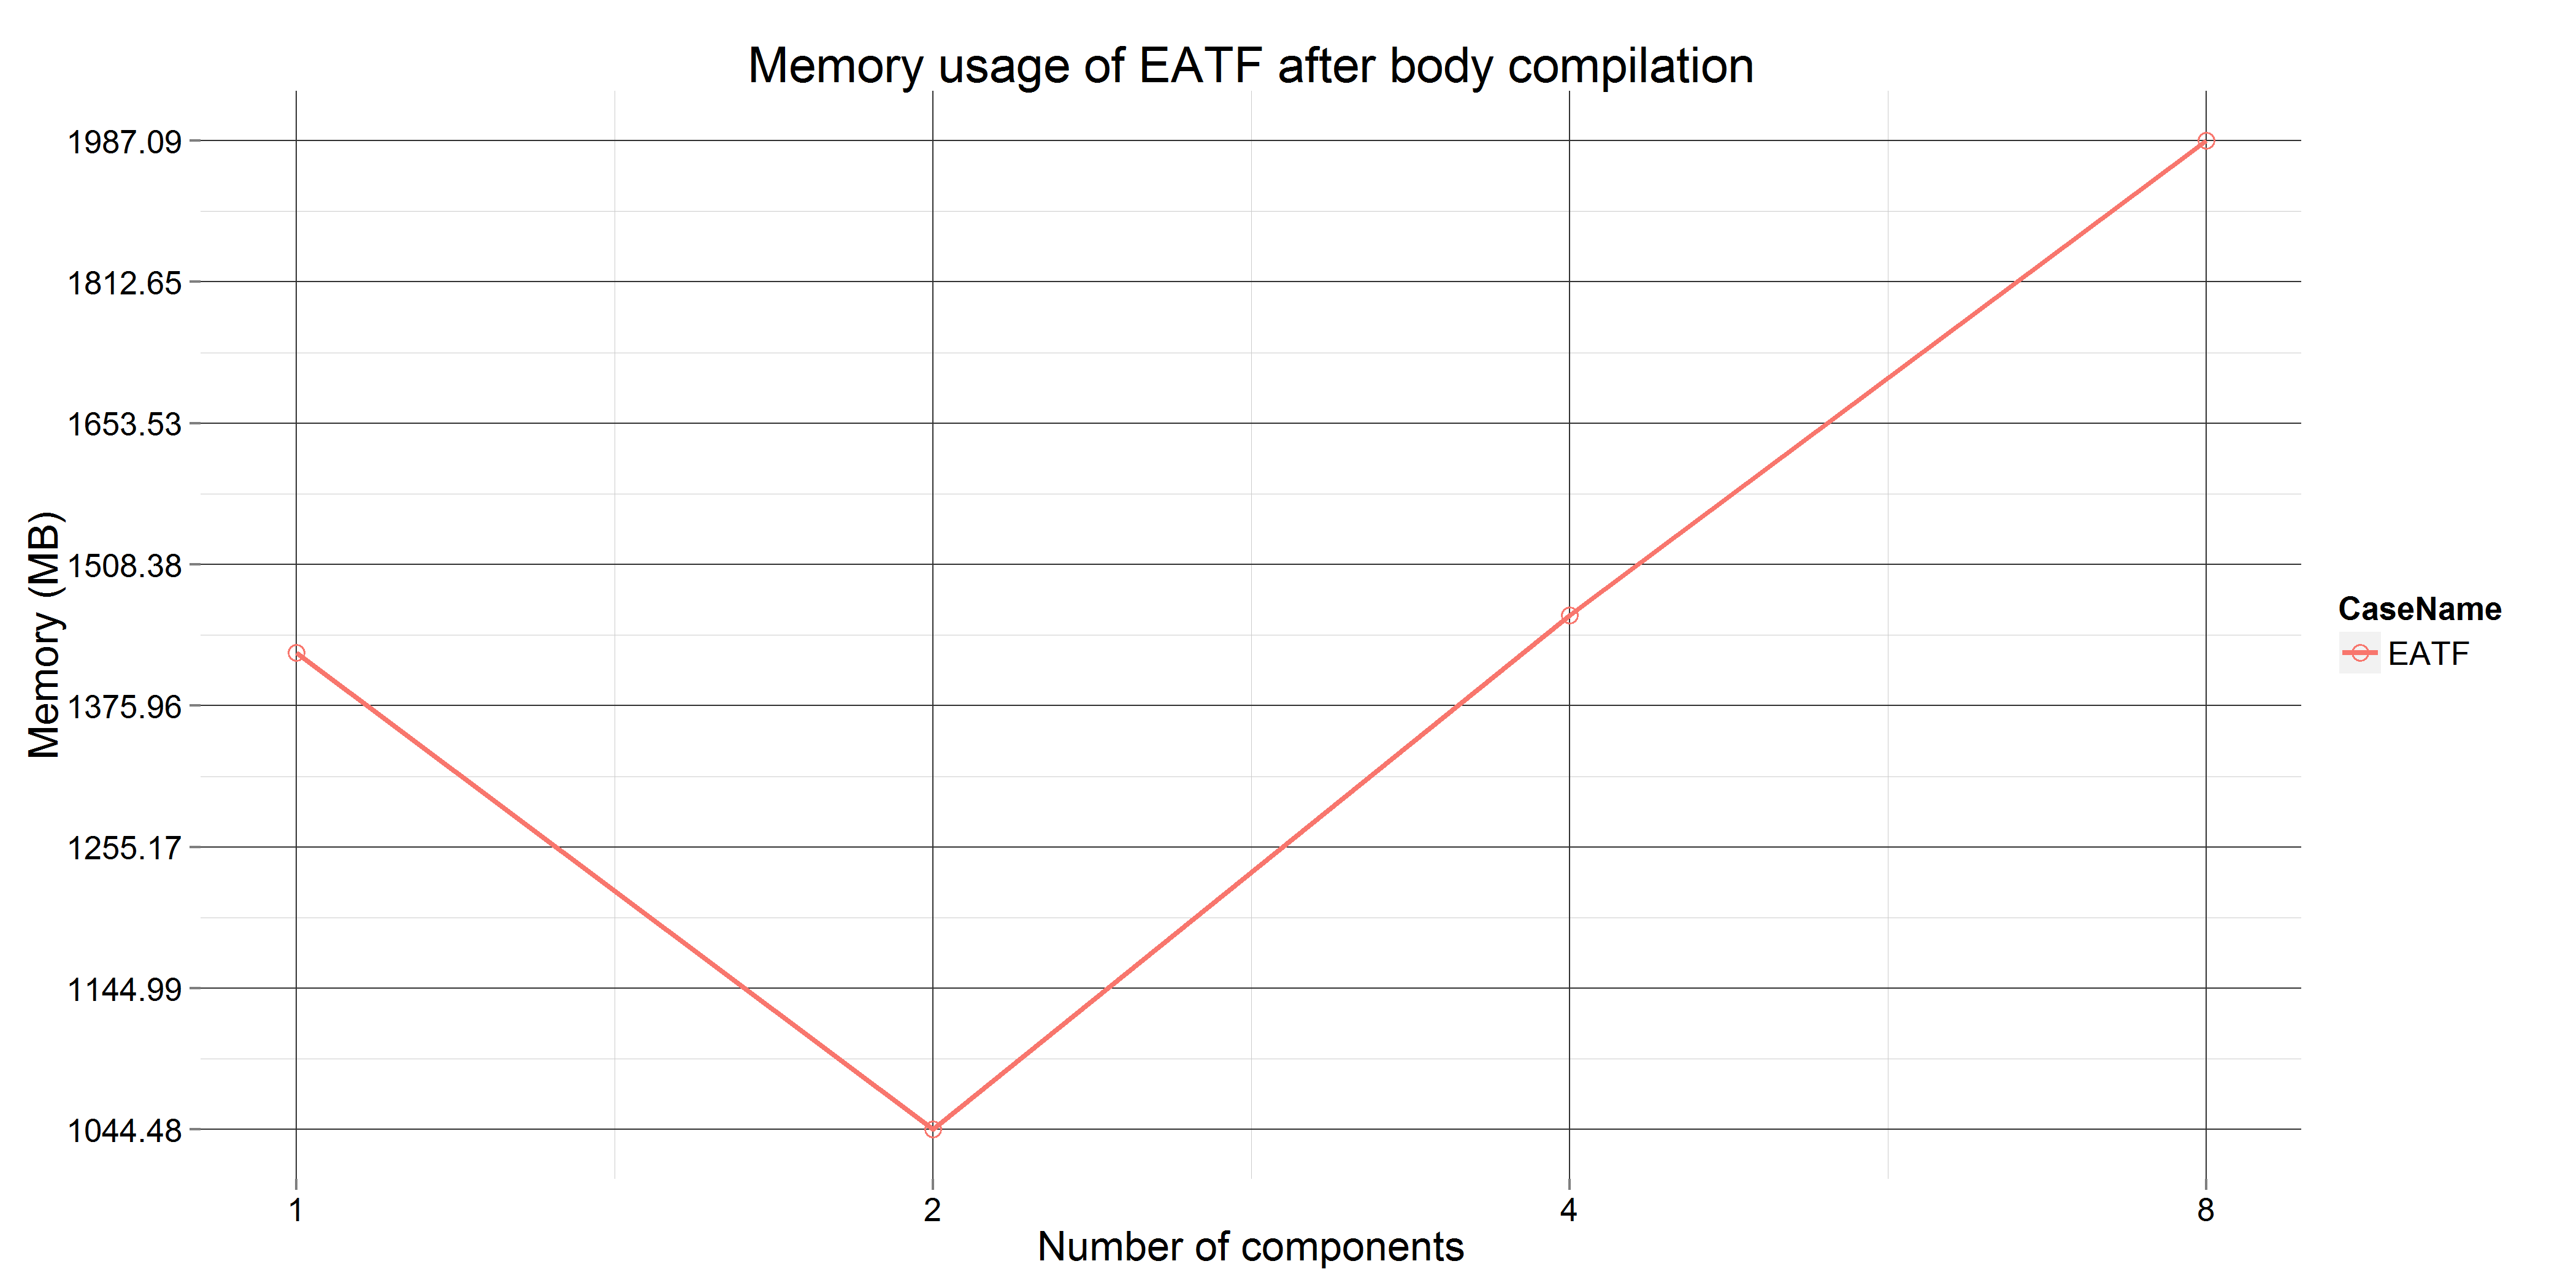
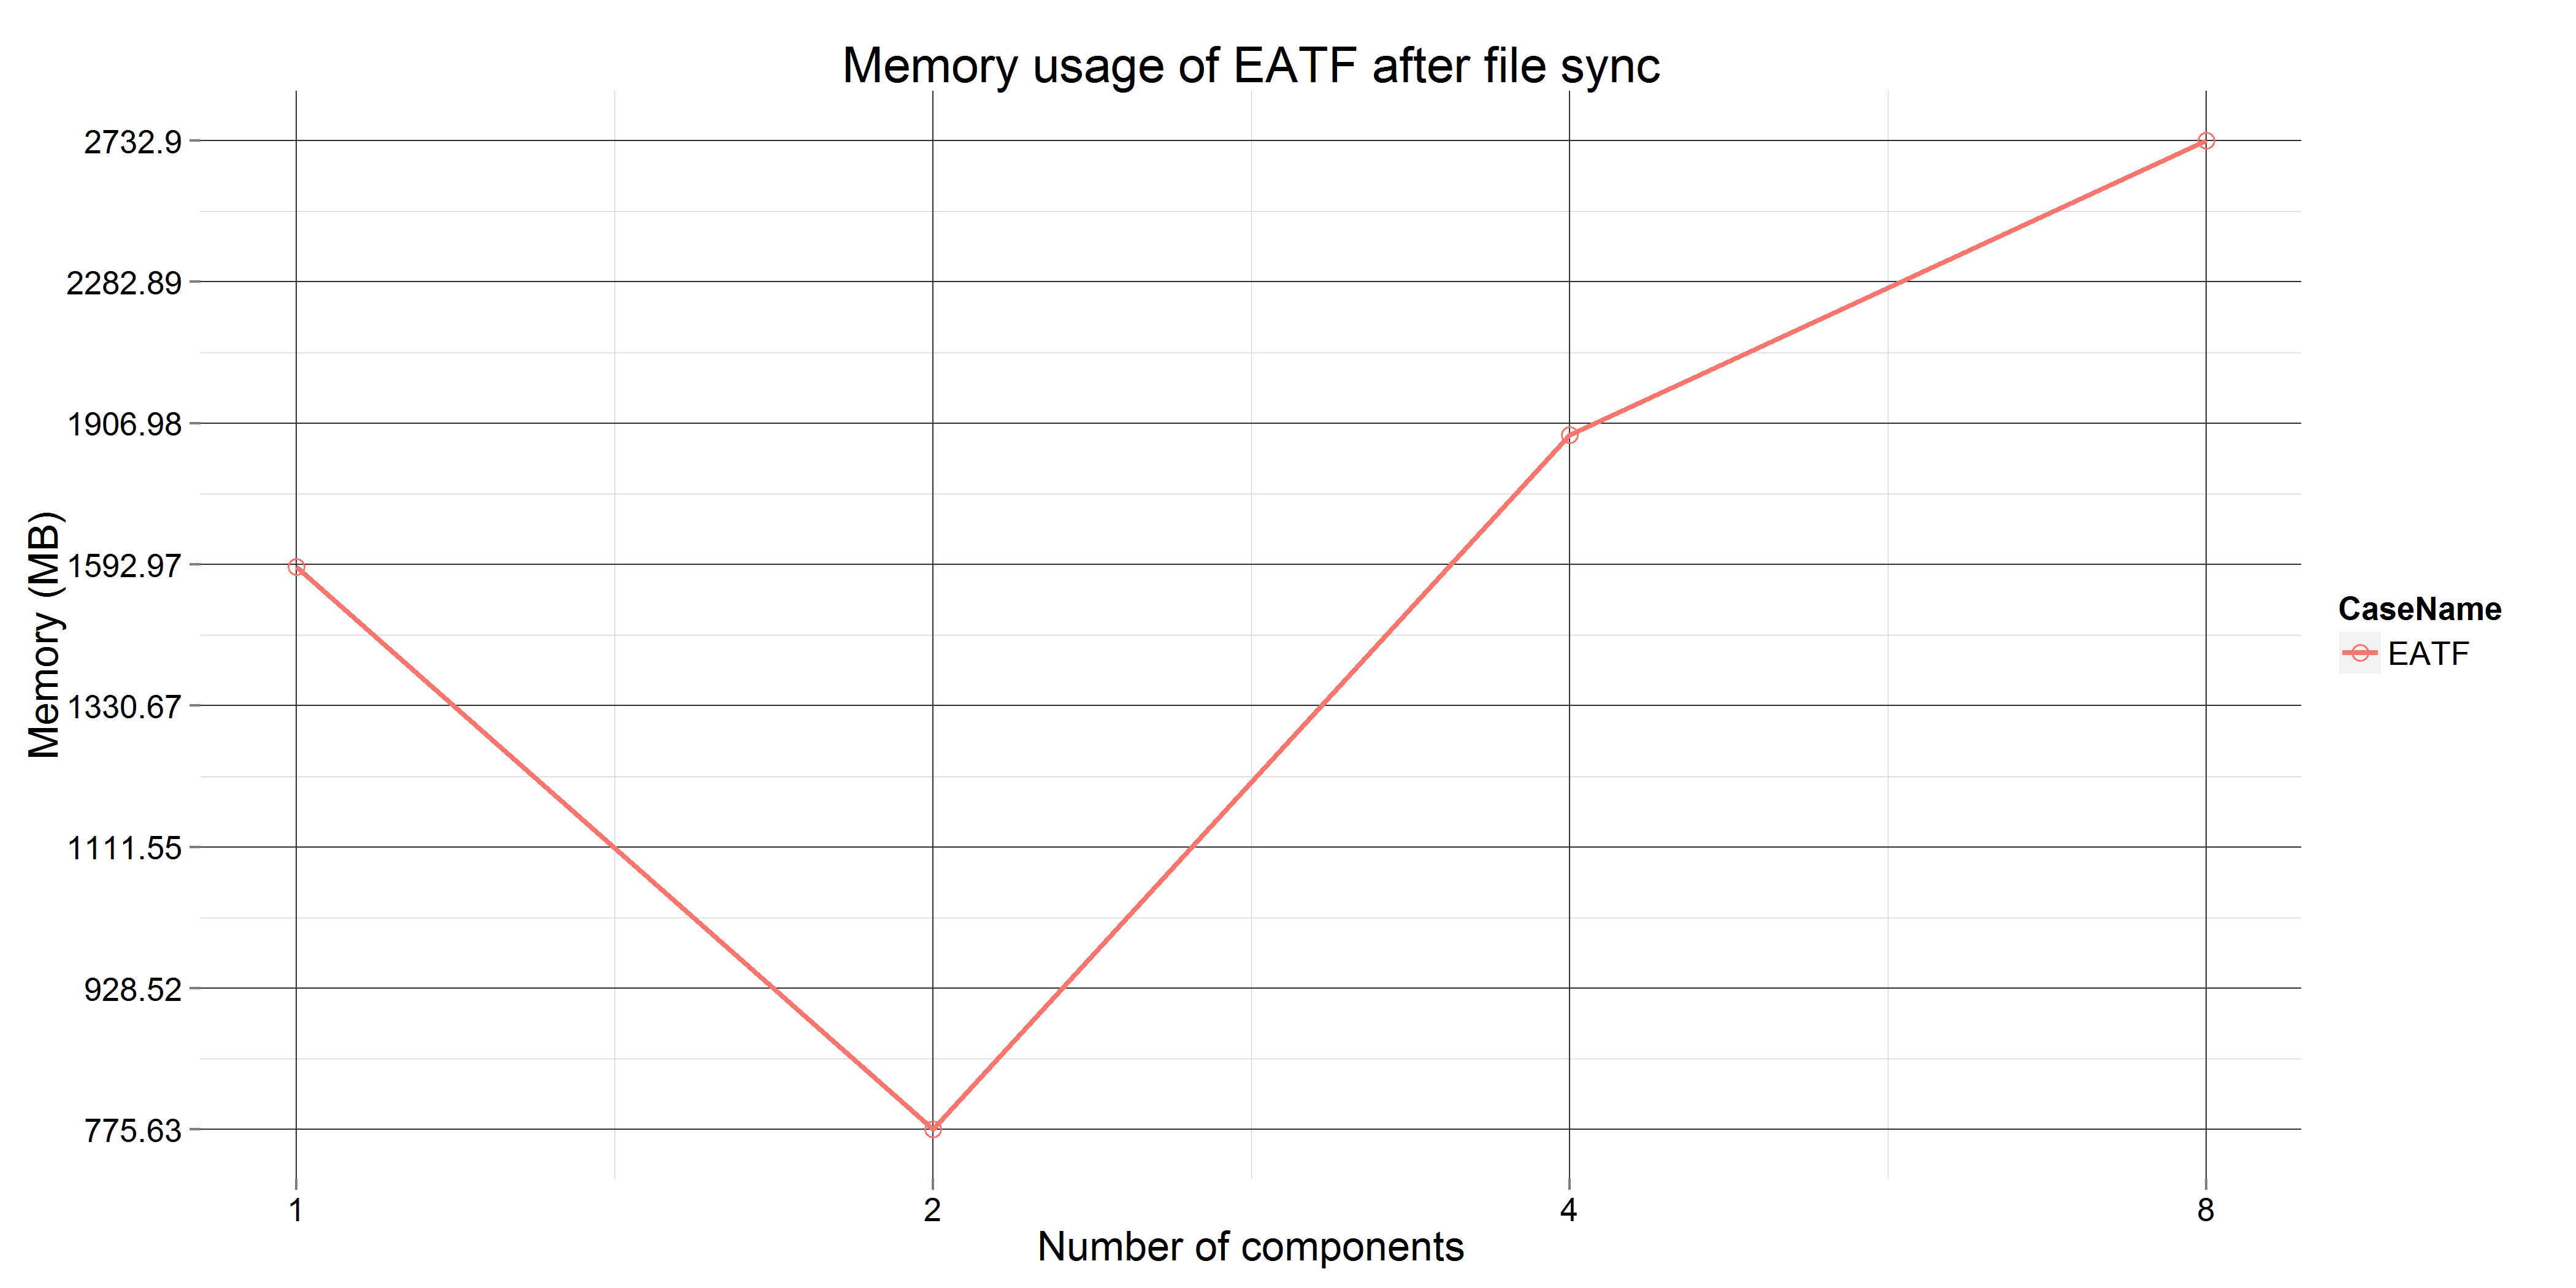
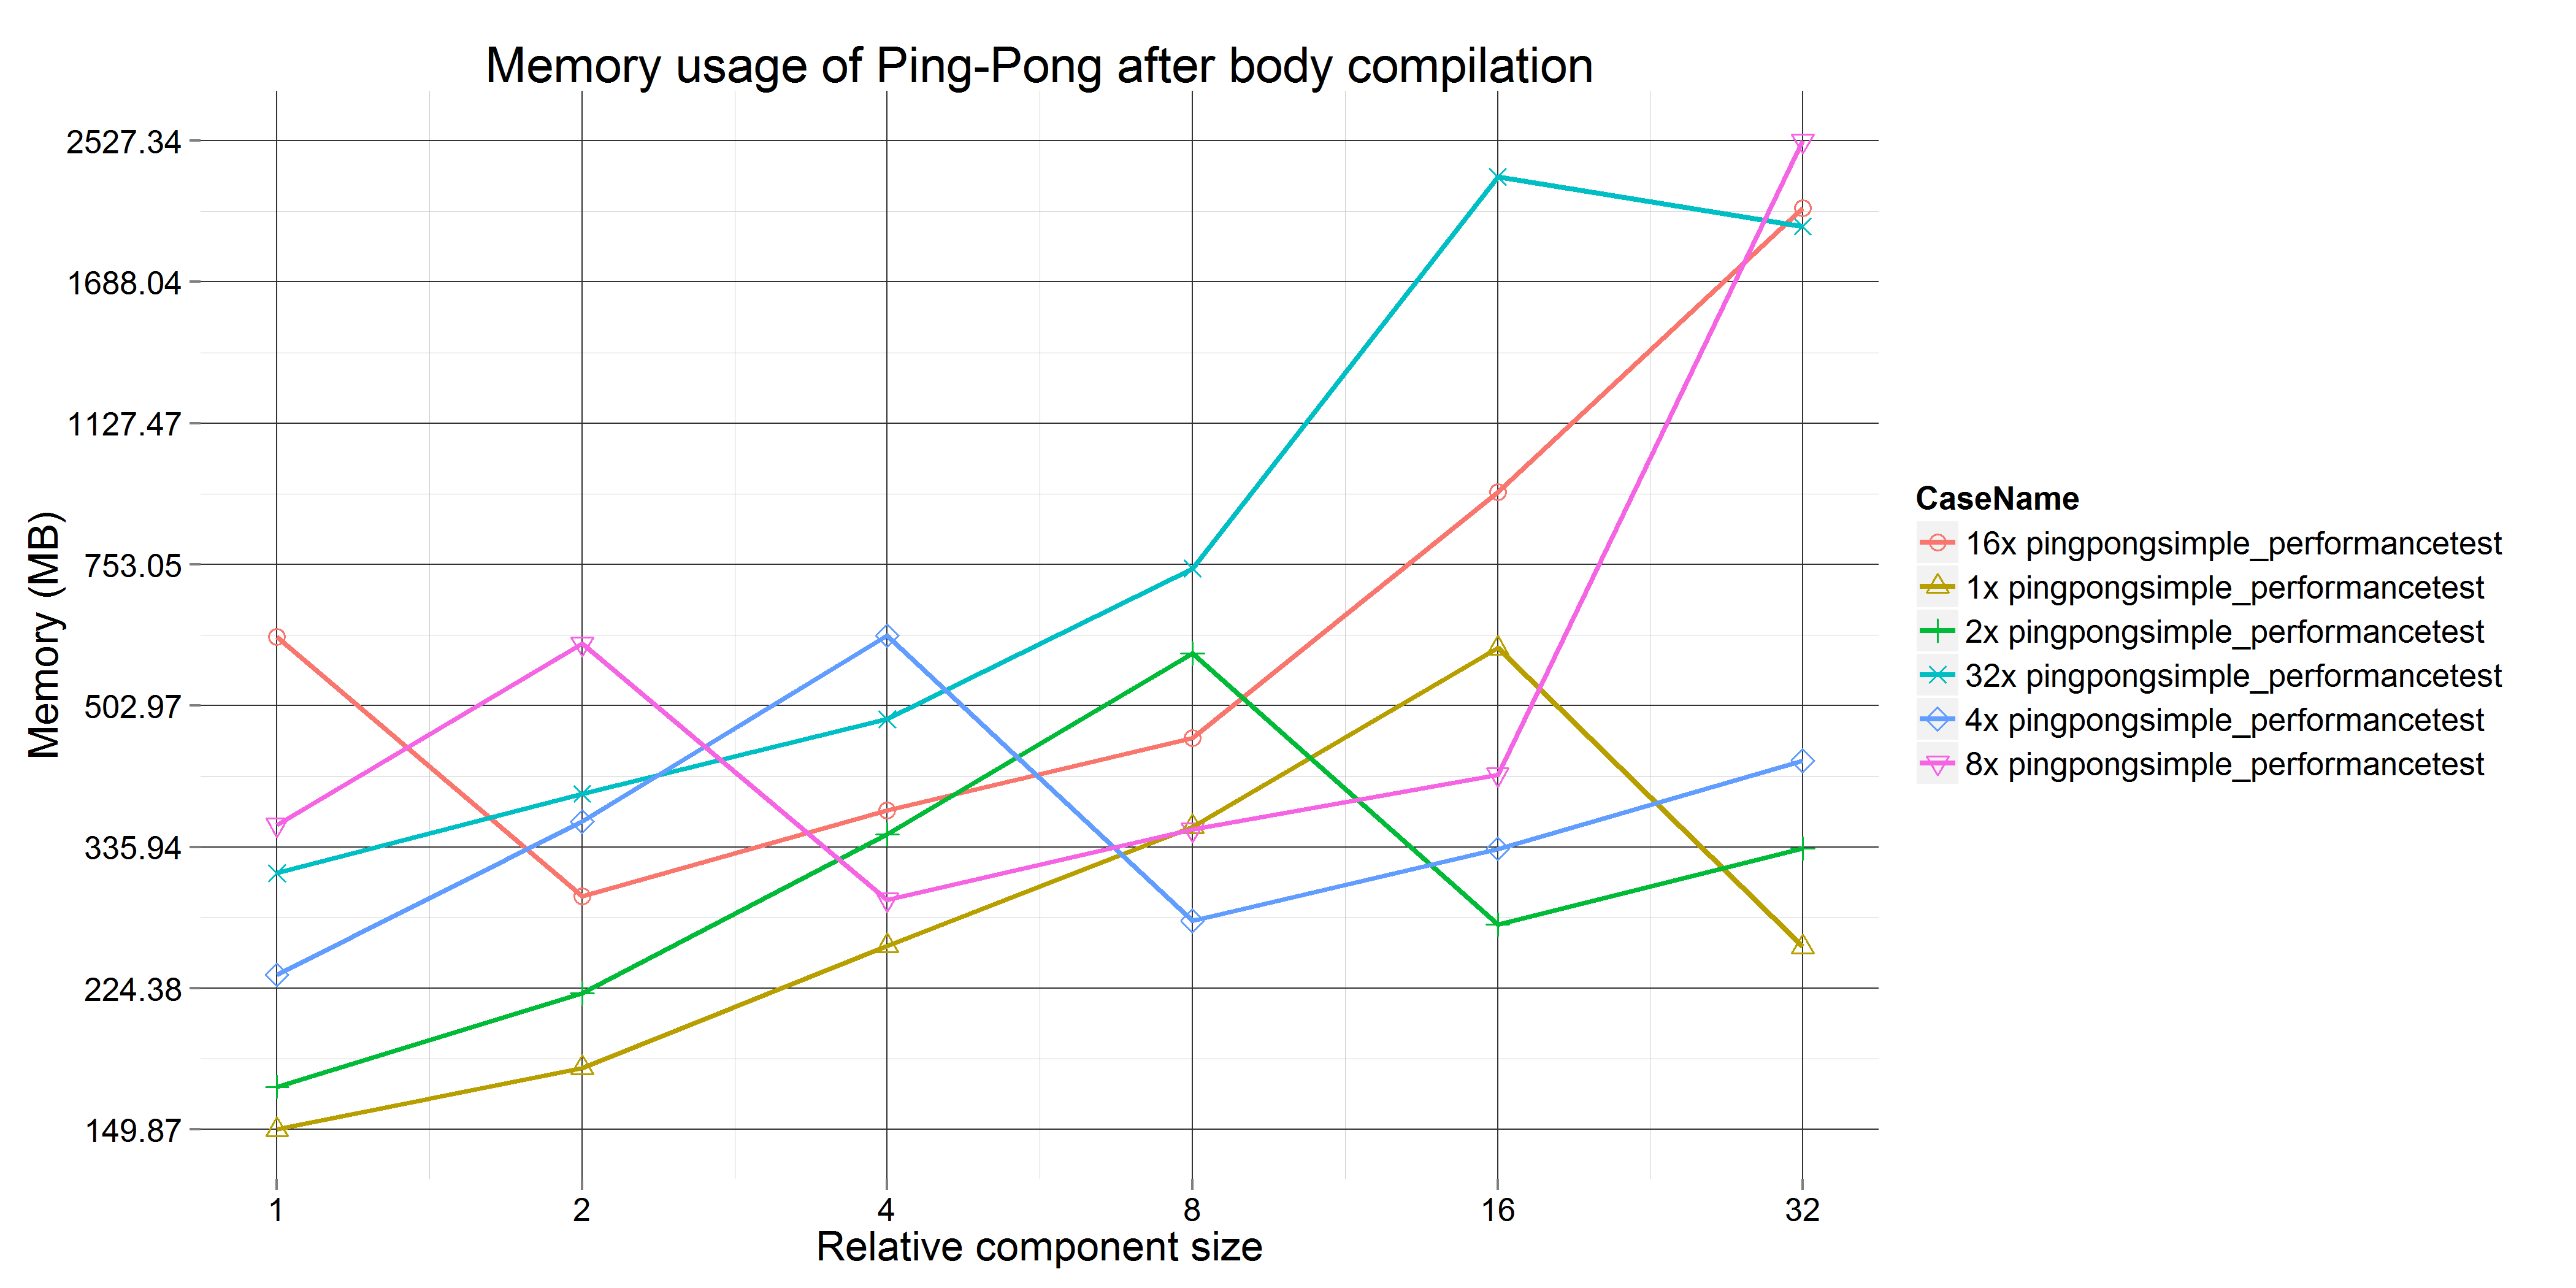
The following two graphs show memory usage data after the rALF action code compilation and file synchronization phases. It is apparent that such measurements are not very exact due to the nature of Java garbage collection and heap management. However, it is possible to glean some overall information on the memory usage of the model compiler for larger models.
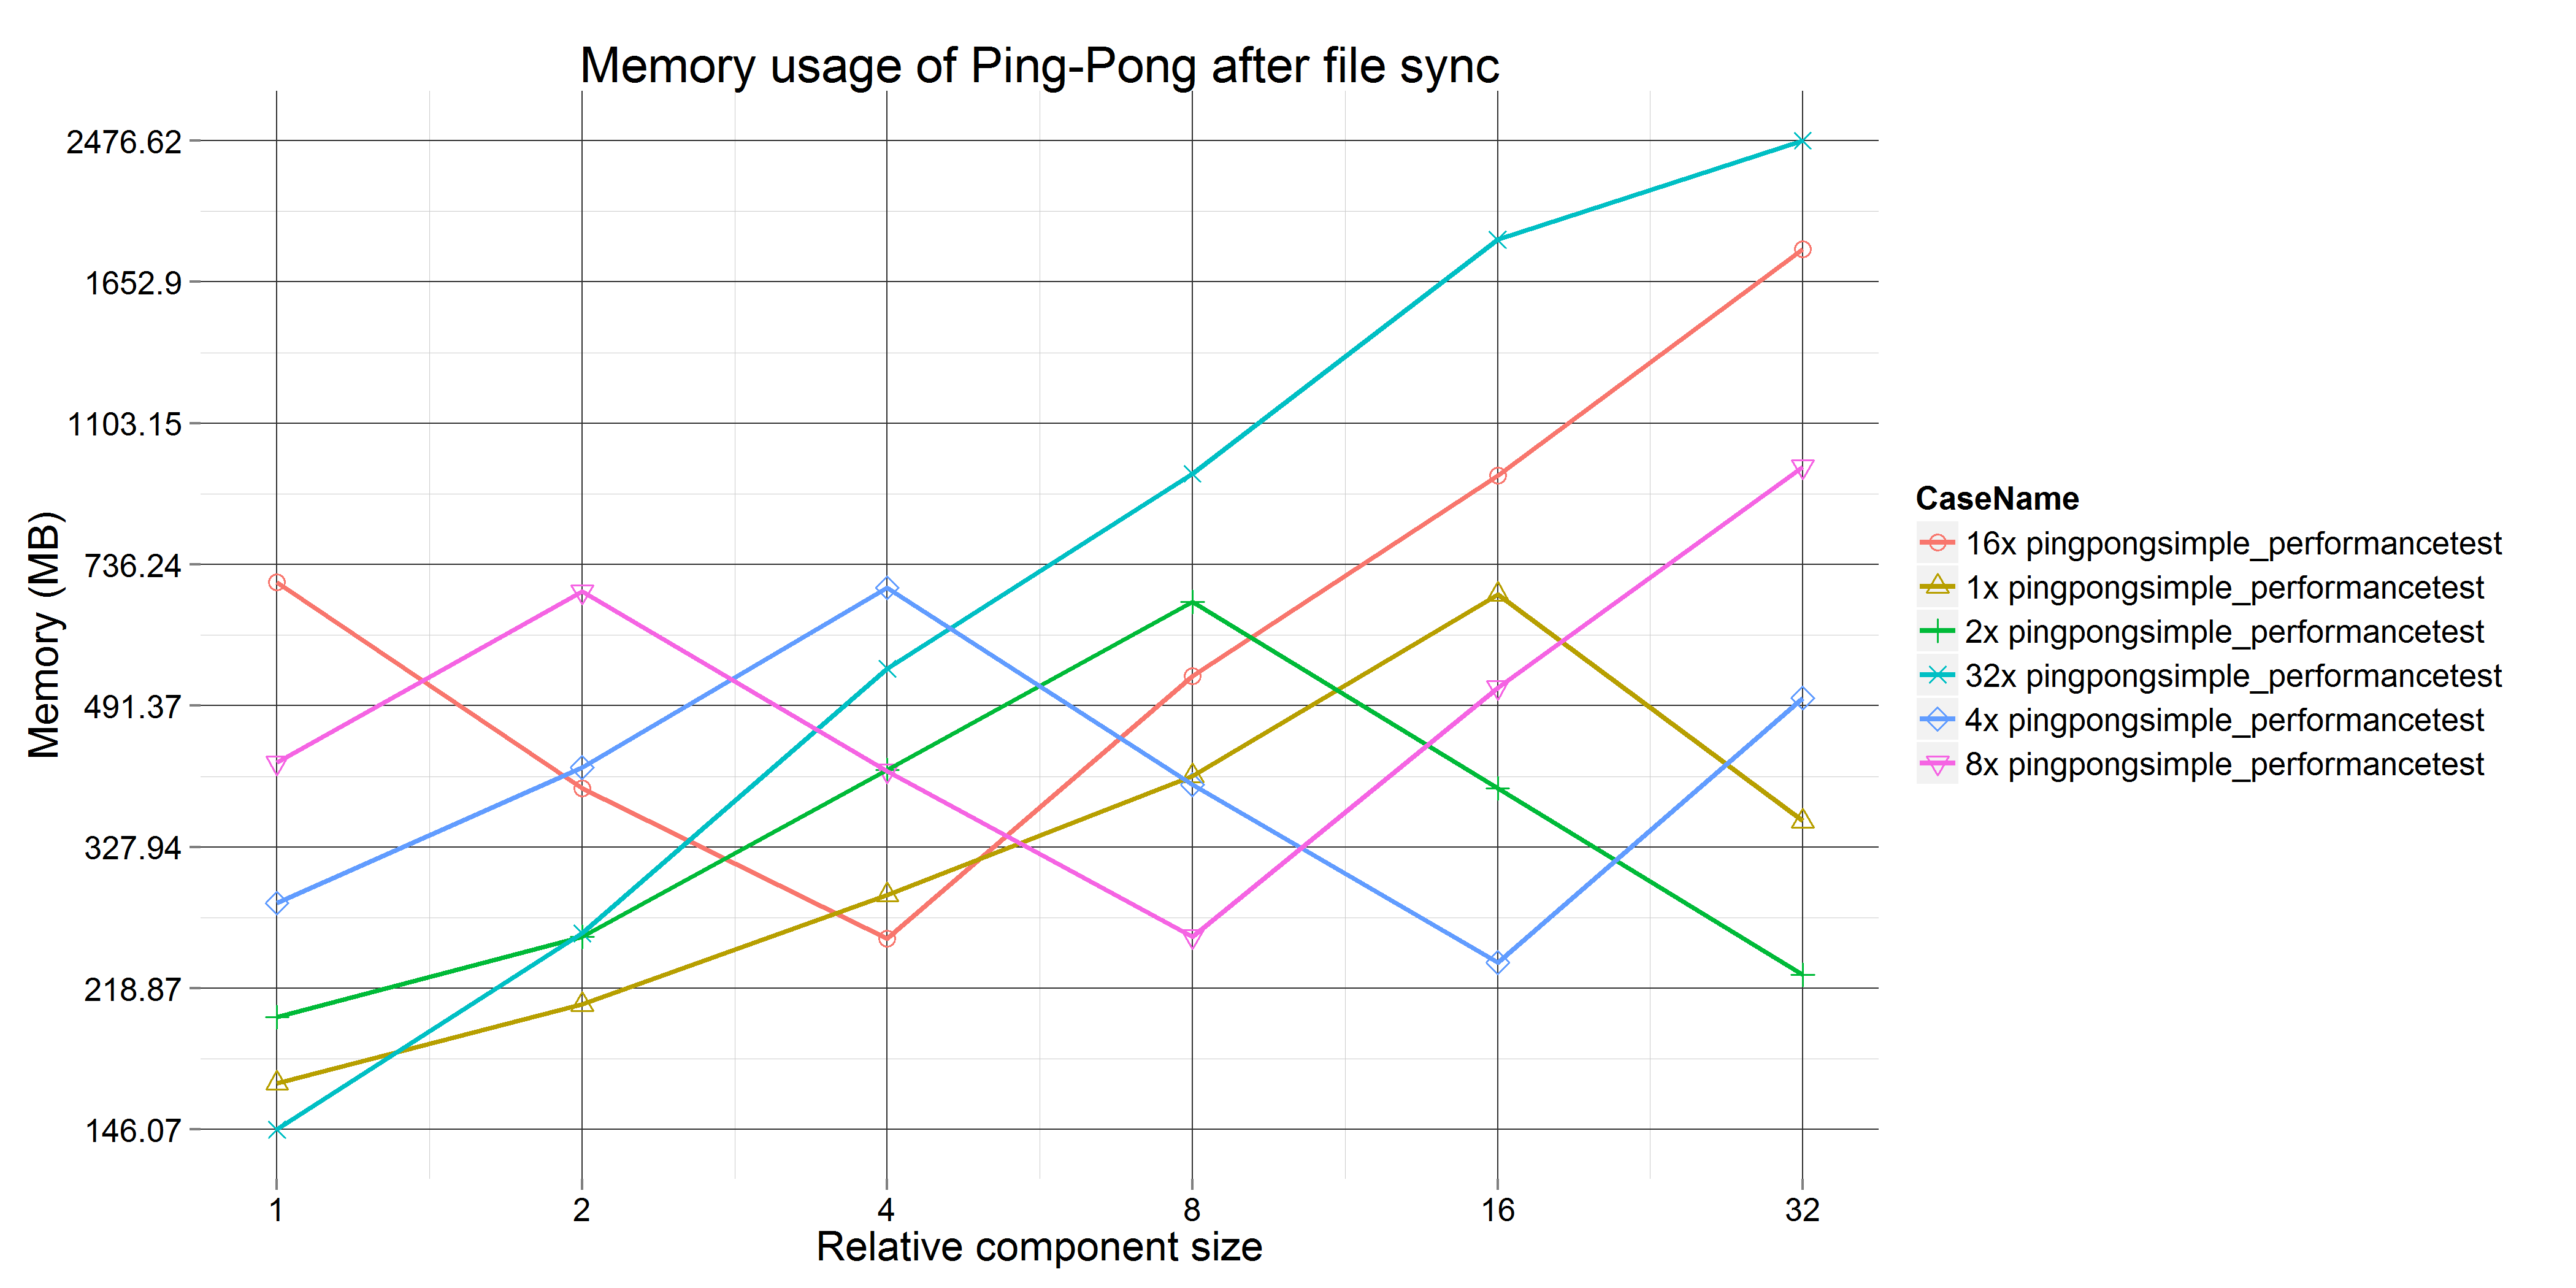
The same graphs are created for the EATF model as well. In this case, the X axis is the number of components in the model. Each component is a copy of the original EATF component.
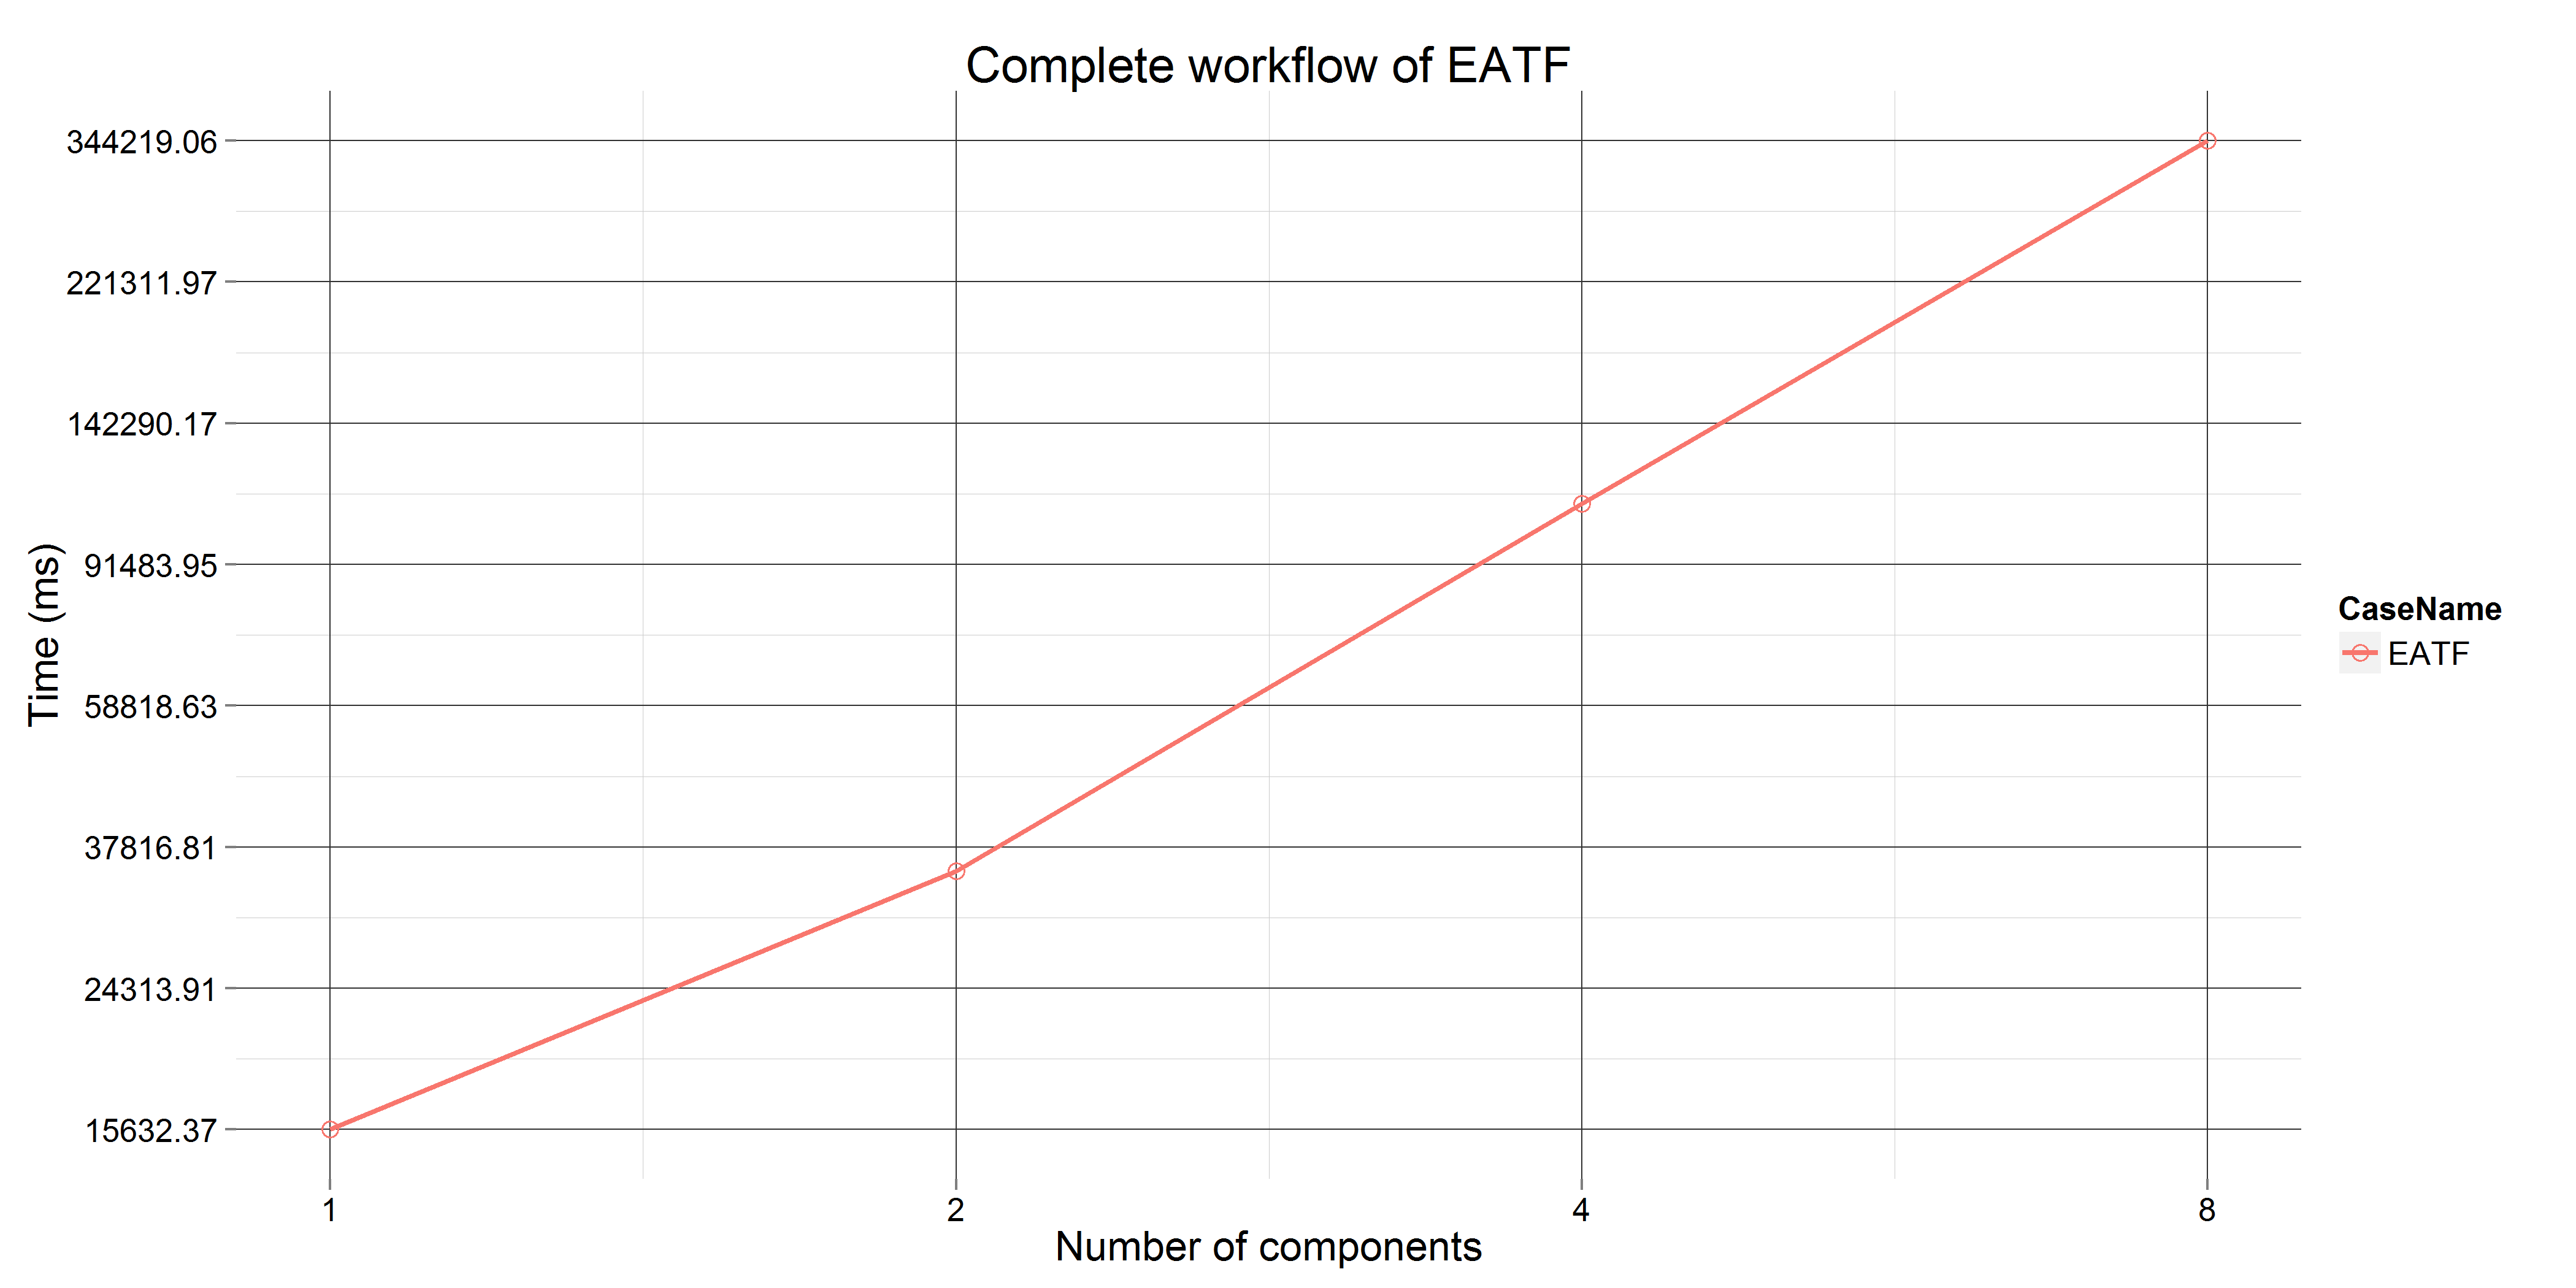
Since the EATF model contains a lot of rALF action code, the ratio of rALF compilation is even higher in this case (335 out of 344 seconds for 8 components).
The EATF model contains very complex components, therefore the incremental compilation of even one component takes time. Note that since the complete component has to be transformed, the modify cycle also includes cleaning up before re-compilation.