-
Notifications
You must be signed in to change notification settings - Fork 83
LinkMeter Home
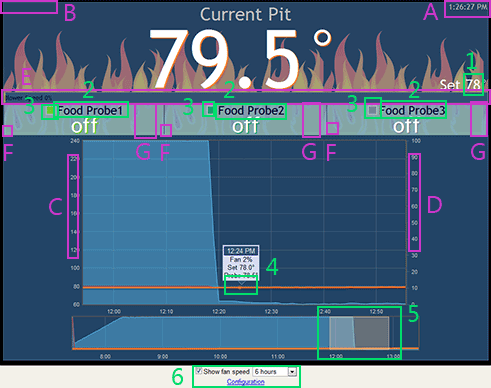
The LinkMeter Home or Status page displays the current temperature, fan speed and graph.

Note: C and D are swapped in newer versions of the software.
| Letter | Name | Description |
|---|---|---|
| A | Last Update | The status page automatically updates and this time indicates the last update time. If the number is gray it indicates communication between the browser and LinkMeter is working, and the time is the last time LinkMeter received data from HeaterMeter. If the time is in red, it indicates communication to LinkMeter has failed and the time is the time of the last connection attempt. LinkMeter runs on UTC so the time displayed here is adjusted for your local time. Hovering your mouse over the time will display the full date. |
| B | Lid Open | If HeaterMeter is in lid open detect mode, the duration remaining is displayed here. While logged in, click to toggle lid open mode. |
| C | Graph Temperature | This axis is for the temperature of probes degrees. |
| D | Graph Fan Speed | This axis is the fan speed percent. |
| E | PID Output % | The current PID output percent is indicated by the size of the bar and the label. There may also be a lighter blue bar inside of the main bar indicating the current blower speed, if max fan speed isn't 100%. The exponential moving average of the output % is displayed as a translucent yellow rectangle "pip" at the correct percentage |
| F | Status Icons | If an alarm is active, there will be a bell icon here. The bell can be clicked to silence the alarm if it is ringing and you are logged in. There is also a jagged line icon, indicating excessive electrical noise on the probe and that the temperature may not be valid. Clicking the noise icon will display the noise graph if logged in. If a probe is of type RF Wireless, the status of the remote connection is indicated in this area with a wifi-looking icon. Mouse over the connection icon for more information |
| G | Degrees Per Hour | If a probe has more than one hour's worth of data, and the current temperature is at least 1 degree higher than it was an hour ago, the number of degrees per hour is indicated here. If the temperature is below the high alarm point, duration remaining until that temperature is reached is also shown. |
| X | Not Shown | Orange regions in the upper graph indicate periods where the system was in lid open mode |
Active regions indicated in green on the example image are interactable. Anything that changes configuration requires you to be logged in.
| Number | Name | Decription |
|---|---|---|
| 1 | Setpoint | Click to modify the target temperature. A number between 0% and 100% (Add the percent symbol) puts the fan into manual mode. Press ENTER to submit, ESC to cancel. |
| 2 | Probe Name | Click to change the probe's name on both the HeaterMeter and web interface. Press ENTER to submit, ESC to cancel. |
| 3 | Graph Legend | Click the box next to the probe name to toggle displaying its data in the graph. Pit and Setpoint can not be removed from the graph |
| 4 | Graph Tooltip | Mouse over or click the graph to display information from that time. The tooltip snaps to the closest probe point (not setpoint or fan speed). See also Peak Information, below. |
| 5 | Overview Graph | Zoom in on the top graph by dragging a selection on the lower overview graph. If the selection extends to the right edge of the overview graph, new points added while zoomed will be included in the selection automatically. Single click the overview graph to reset the selection. |
| 6 | Misc Controls | Toggle fan display of fan speed, set graph range, login (and return to home screen) or configuration (login and go to configuration page) |
| Key | Date added | Description |
|---|---|---|
| N | 2020-01-10 | Turn on Noise dump information (takes 5 seconds to take effect) |
| P | 2013-04-19 | Toggle the PID Internals display (except Internet Explorer, including IE10) |
The last low and high peak are displayed on the graph when the mouse is close enough to the peak. These and the associated values below are intended to assist PID tuning.
Also displayed is the period of the oscillation (the time from one high to the next high, or from one low to the next low). The "half" number is the last half of the period (the last low→high, or high→low) - which can be compared to the overall period. For example, if the low→high is short but the high→low is long, then you are probably giving the system too much air and overshooting, or you can't damper the fire enough to bring the temperature back down.
The degree indication to the right of the "half" number is the gain from the last period's high→low to this one. With perfect oscillations where each time the high and low are the same, this is 0. If this number is positive, things are getting more out of control over time. If negative, they are dampening around the setpoint.
High/Low Peak explanation from: Development Log post782530